ARE YOU READY TO TAKE YOUR DEBUGGING TO THE NEXT LEVEL?!
ARE wp_die AND print_var JUST NOT CUTTING IT!?

XDEBUG IS THE ANSWER!
Xdebug is a PHP extension that provides advanced debugging capabilities such as breakpoints, watch expressions, and more in-depth error reporting.
Setup Xdebug
Xdebug needs to be set up with your local hosting system, whether that is MAMP, Vagrant, or a custom solution. I will be going over how to set it up with Vagrant and Varying Vagrant Vagrants (VVV). MAMP also has a pretty simple system for getting it running.
VVV has Xdebug installed by default, but it needs to be manually activated. You can do this by ssh-ing into the Vagrant instance (vagrant ssh) and running xdebug_on. You will need to do this after each time you destroy and recreate the Vagrant instance.
You can also turn off Xdebug (if the extended error messages are bugging you) by ssh-ing into Vagrant and running xdebug_off.
So now that you have Xdebug running, how do we dig into the good stuff? First off, your PHP error notices will be replaced with something like this:
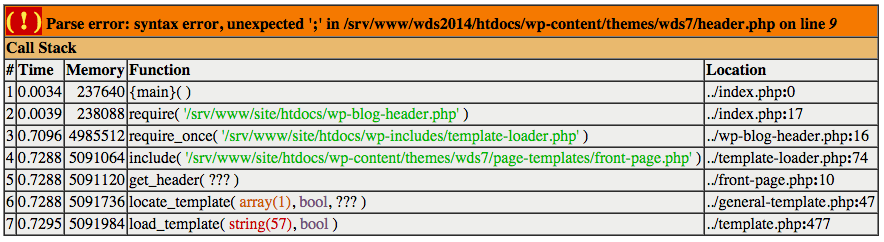
This more descriptive notice shows you the stack trace of the error, meaning you get to see everything that led up to this error (which function called which function called the function that the error occurred in) and allows you to get a better idea of the context of the error.
But there is a lot more to Xdebug than that! In order to get the rest of Xdebug’s expanded debug capabilities you need a Xdebug client– I’m going to show how to hook up the Sublime Text Xdebug plugin.
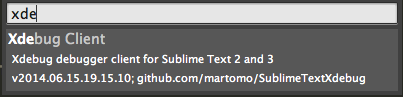
First install the plugin using the Sublime Text Package Control (which of course you already have installed) by pressing CTRL-SHIFT-P and choosing “Package Control: Install Package”, and then selecting “Xdebug Client”.
Once the client is installed, you need to configure it to properly interface with VVV’s Xdebug setup. Open the Xdebug Client’s settings by pressing CTRL-SHIFT-P and then select “Preferences: Xdebug Settings – User” (You can view more available options by selecting “Preferences: Xdebug Settings – Default”).
{"path_mapping":{"\/srv\/www":"\/path\/to\/vagrant-local\/www"},"max_depth":5}
Just change “/path/to/vagrant-local/www” to the absolute path to your VVV www folder, and the Sublime Text Xdebug Client will know where to look for your local code.
Using Xdebug
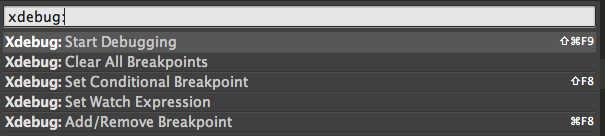
Now that you have Xdebug activated and connected to Sublime Text, you can control the Xdebug Client by pressing CTRL-SHIFT-P and running the various Xdebug commands.
One of the best features of Xdebug is the ability to add breakpoints and run through your code line by line. Let’s say you are having a mysterious issue and you want to see what exactly is going on at one point in your code.
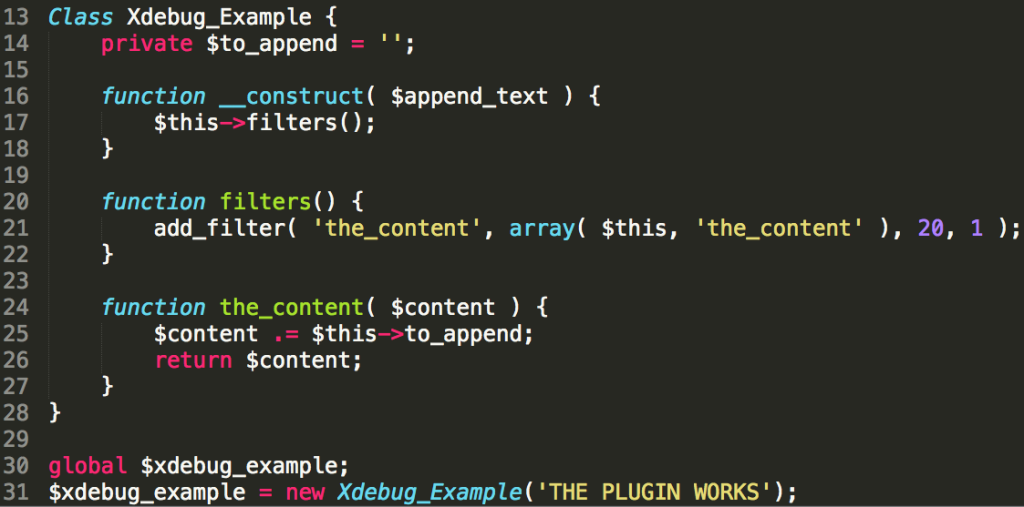
This little plugin is pretty simple, you can probably already see the reason that ‘THE PLUGIN WORKS” isn’t output after the post content, but this is just an example. Much larger, more complex bugs can be fixed by following this same method.
So we have our code, we have the post being rendered without the ‘THE PLUGIN WORKS’ text at the end, and we have no idea why. Lets add a breakpoint! By moving the cursor to line 25 and pressing “CMD-F8” or “CMD-SHIFT-P” then searching for “Xdebug: Add/Remove Breakpoint”.
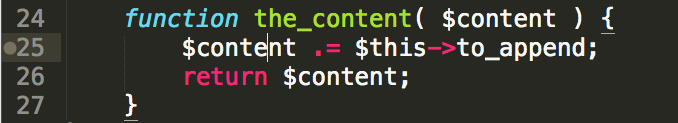
That little dot next to the line means we have a breakpoint there! Make sure Xdebug is on in VVV and connect Sublime Text to VVV’s Xdebug by running the “Xdebug: Start Debugging” command (CMD-SHIFT-F9).
Now go back to the browser and refresh the page. It will seem like it starts to load, and then hangs loading indefinitely. This is because the breakpoint has taken effect and paused the PHP process so you can take a look. Switch back to Sublime Text and it should look something like this:
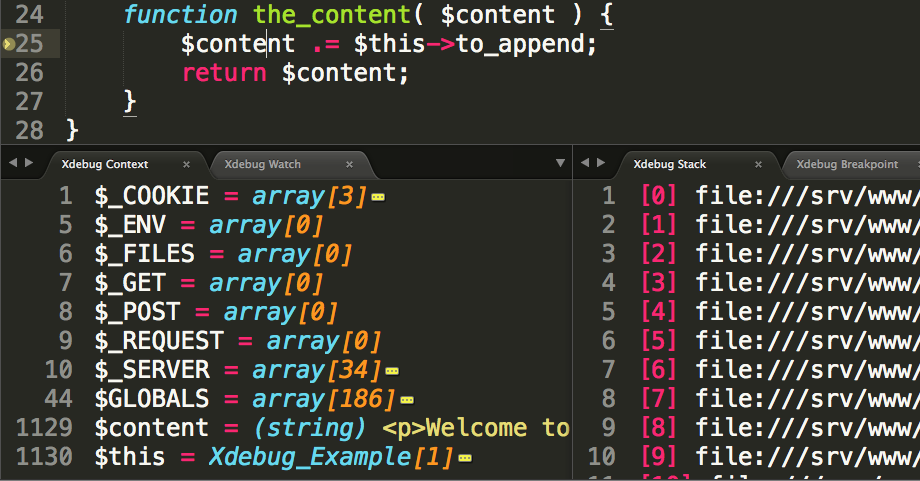
The yellow arrow marks the line that PHP has paused at, this line has not run yet. The Xdebug Context window shows local and global variables that are currently accessible. The Xdebug Stack window shows everything that led up to this point in the process (what chain of functions led to the current function being called).
For this bug we are paying attention to the Xdebug Context, we want to see why nothing is added to the $content variable. If I expand the $this object so we can inspect the local to_append variable I can see that it is empty:
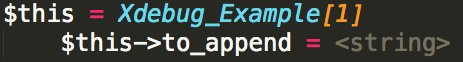
Looking back up at the constructor function I can see that the variable was never assigned to, so adding $this->to_append = $append_text; to right after line 17 fixes the problem. Go ahead and detach the current debug process by pressing CMD-SHIFT-P and searching for “Xdebug: Breakpoint – Detach” this will let the page continue to load.
Once the fix has been made I can refresh the page again, the breakpoint will take effect again and this time I can see in the Xdebug Context that my fix has worked:

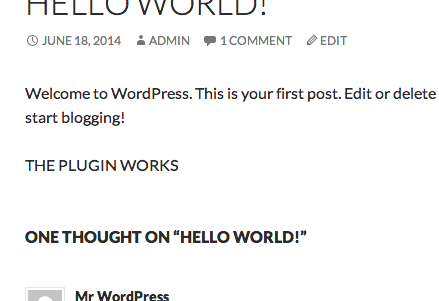
and if I run “Xdebug: Stop Debugging” (and “Xdebug: Restore Layout”) the page will finish loading and I can confirm the plugin works as intended:
Going Deeper
There is a lot more power to Xdebug than what I have shown you so far, when you are at a breakpoint you can also navigate through the code to see how things play out.
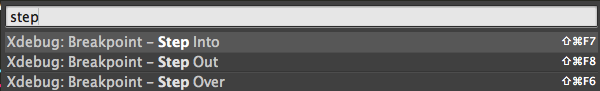
Using these three-step functions you can:
- Step Into – Enter the function invoked at the current line and continue debugging. Use this if you are getting unexpected results from a function call and want to investigate further.
- Step Out – Exit the current function to the function that called this function (check the Xdebug Stack to see what this is).
- Step Over – Run the current line and move to the next line. Repeatedly running this allows you to go step by step through a function and see what is happening.
It can even be fun to navigate bug-free code with these tools to just see everything in slo-mo action.

So go ahead and dive in! It may seem intimidating at first but it is incredibly powerful and gives so much more information and control than logging can. If you aren’t using VVV and Sublime Text there are other methods of getting Xdebug working, and I recommend looking into it, it’s worth it!
More Resources
- Sublime Text Xdebug Plugin – More info on using and configuring the plugin
- Xdebug Site – The guts
- Xdebug remote debugging docs – Includes general debugging and list of other Xdebug clients
- VVV Code Debugging Tutorial – Includes setting up XDebug with VVV
Comments
1 thought on “Debugging with Xdebug, VVV, and Sublime Text”