Sometimes things happen on a page that you can’t figure out. You click on a link and nothing happens; you submit a form and a modal pops up. Something is happening in JavaScript, but you can’t figure out where.
Enter, once again, the Chrome Developer Tools.
Let’s say we have a link on the page that when clicked, instead of taking us to the URL in its href attribute, throws error messages all over the page randomly. A quick search all of your codebase returns no clear clues towards what script could be causing it. There are either too many references to the link to filter through, or nothing that seems to point directly to this link. We need to check what events are bound to this DOM node.
To do this, open up Chrome on the page, right click on the element, and click “Inspect Element.” This opens up the familiar Chrome Developer Tools. Hopefully you are already familiar with the basics here, inspecting elements and their styles, and basic JavaScript debugging (if you aren’t do yourself a favor and do a bit of looking around and look up some tutorials!). What interests us now is the “Event Listeners” tab on the right in the elements screen (which should be the screen that opens when you use “Inspect Element”).
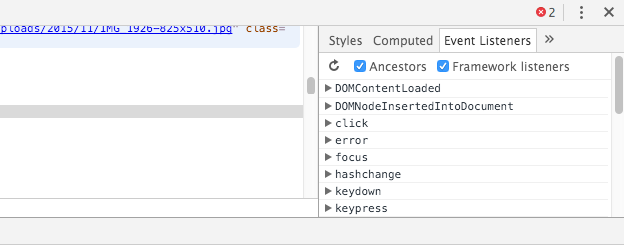
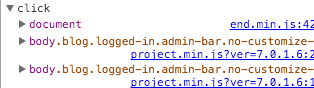
Under this panel, you should see a bunch of expandable event names and under each links to the functions that are bound to that event on the currently selected element. For our example, we should check out the click event to see what scripts we have bound to that event. On the left, we can see the DOM node the event is specifically bound to (events can be bound to a parent object listening for actions on child objects), and on the right, we can see the script and the location in the script of the function that is bound to that action.
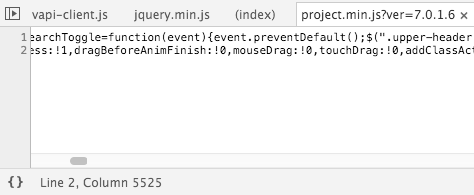
Clicking on that file name will bring us to the Sources page of the Developer Tools with that file shown. From here you can read through each function bound to the event and find which seems most likely to be the one triggering the behavior you are trying to figure out. You can add breakpoints and pause the code mid-execution to check exactly what is happening that may be causing the issue.
If the code is minimized make sure to click the “Pretty Print” button in the bottom left of the source view to expand out the code for easier reading, turning this:
Into this:
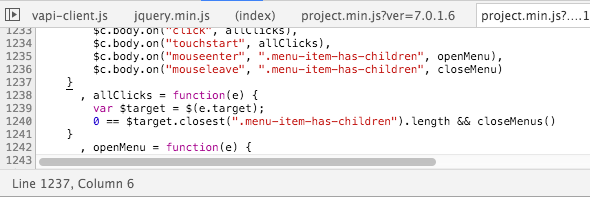
Much better, right?
Do you have any questions? Other tips you’d like to add to the mix? Throw them in the comments below!
Excellent, as wp gets more javascripty these things are what php developers are going to look for. A good follow up to this post could be how to add custom event listeners