

In a previous post, I wrote about how awesome PHPStorm is in the context of being a front-end developer. In this post, we are going to look at getting the PHPStorm debugger setup to work with Xdebug and then test it to make sure it’s working!
In my opinion, one of the most overlooked and underused features of PHPStorm is its debugger. I’ve only just recently started to learn about it and use it. One of the biggest reasons it is underused, even by developers who are already using PHPStorm, is because setting it up can be a confusing process if you’ve never done it before. Despite how it may appear, it’s very simple to setup, and once you do it a time or two, it’s something you can do in just a few short minutes.
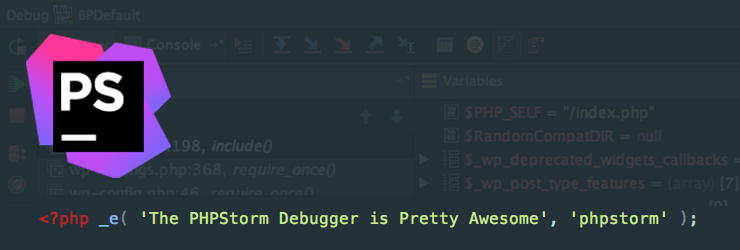
The PHPStorm debugger will make you never want to use a var_dump() ever again!
I currently use Vagrant for my development environment which comes prepackaged with Xdebug. If you’re using something else like MAMP or XAMP, you’ll need to make sure you have Xdebug installed and activated.
Configure PHPStorm and Xdebug
In order for the PHPStorm debugger to work, it needs to be configured to work with Xdebug. Don’t be alarmed by the number of steps it takes to configure; I just wanted to be as detailed as possible.
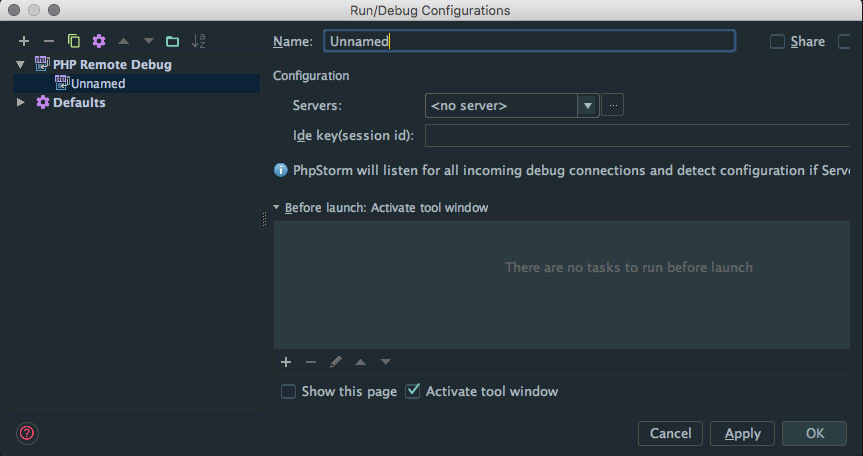
1. In PHPStorm, go to Run > Edit Configurations. This brings up the Run/Debug Configurations window.
2. Click the + (top left) and select PHP Remote Debug from the drop-down to add a new config.
At this point, you should have a window that looks like this:
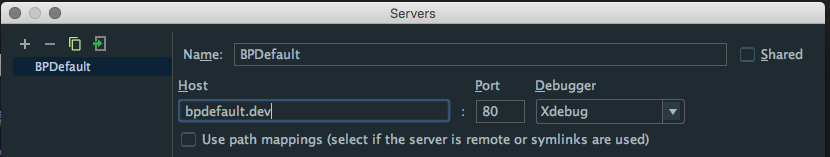
3. Click the ... next to Servers: so we can configure a server.
4. In the Servers dialog, click the + to add a new server configuration.
5. Enter in a Name and the Host address.
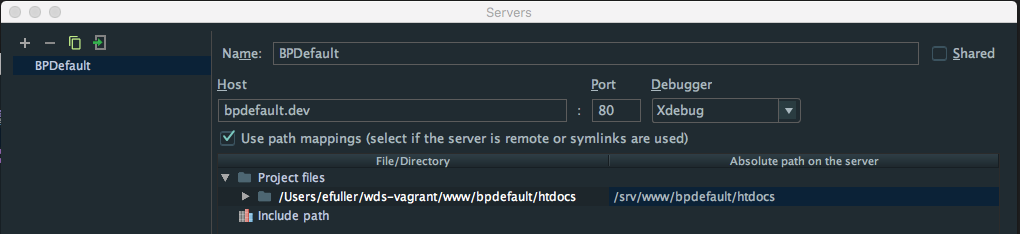
6. This step is for Vagrant users only. If you are not using Vagrant, please skip to step 7.


Click Use path mappings to configure file location settings. The File/Directory should already be preconfigured. Under Absolute path on server, you will need to enter in the path to your projects htdocs folder on your vagrant server. It should look something like this:
7. Click Ok to save and close out the Servers dialog.
8. You should now be back at the Run/Debug Configurations dialog, but there should be a selection in the Servers: section with the server that was just configured.
9. Add in a Ide key(session id) of VVVDEBUG.
10. Check the checkbox for Single instance only.

The fully configured Run/Debug Configurations dialog should look like this:
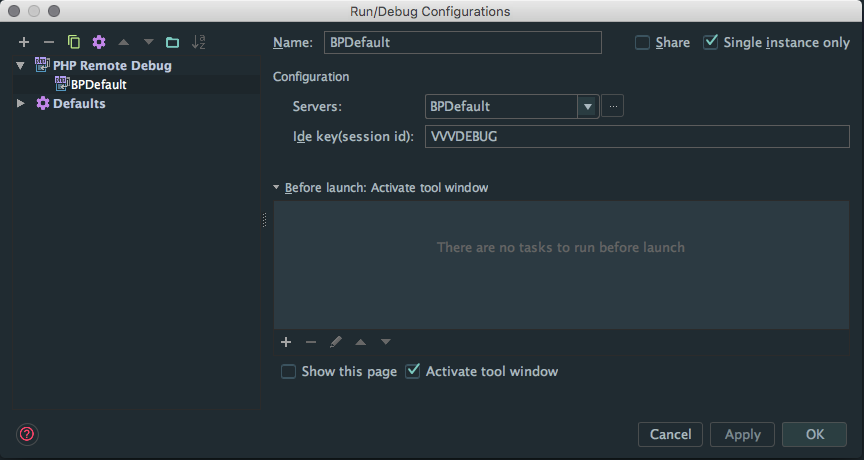
11. Click Ok to close and save everything out!

To recap:
- Go to
Run > Edit Configurations - Configure the server and the path mappings if you are using Vagrant
- Give the configuration a name and set the Ide key to VVVDEBUG
See, it isn’t that bad after all!
The Big Test
Now that we have PHPStorm configured to work with Xdebug, it’s time to test it out and see if it is actually working. The debugger works like most others in that you’ll set a breakpoint in your code for investigation, and then reload the page. When the page reloads, PHPStorm will take over when the breakpoint is reached.
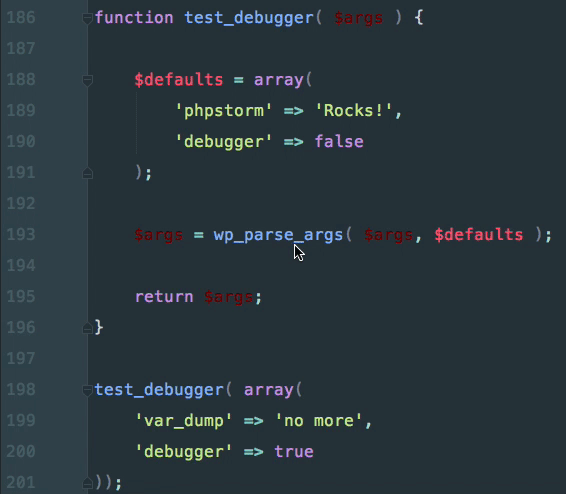
For this test, I’m going to add the following function to my functions.php file. It’s just a simple function that will merge two arrays using the nifty wp_parse_args() function.
Here’s what it looks like:
function test_debugger( $args ) {

    $defaults = array(
        'phpstorm' => 'Rocks!',
        'debugger' => false
    );

    $args = wp_parse_args( $args, $defaults );

    return $args;
}

// Call test_debugger
test_debugger( array(
    'var_dump' => 'no more',
    'debugger' => true
));
In my code, I’m going to set a breakpoint by clicking in the gutter at the exact spot where I want the debugger to kick in.

After the breakpoint is set, PHPStorm needs to be put into Debug Mode. This can be done by using Control + D or by going to Run > 'BPDefault' where ‘BPDefault’ is the name of the configuration created earlier.
After debugging is turned on, all that’s left is to reload the page and keep an eye on PHPStorm to work its magic!
Now, for the gif of all gifs:
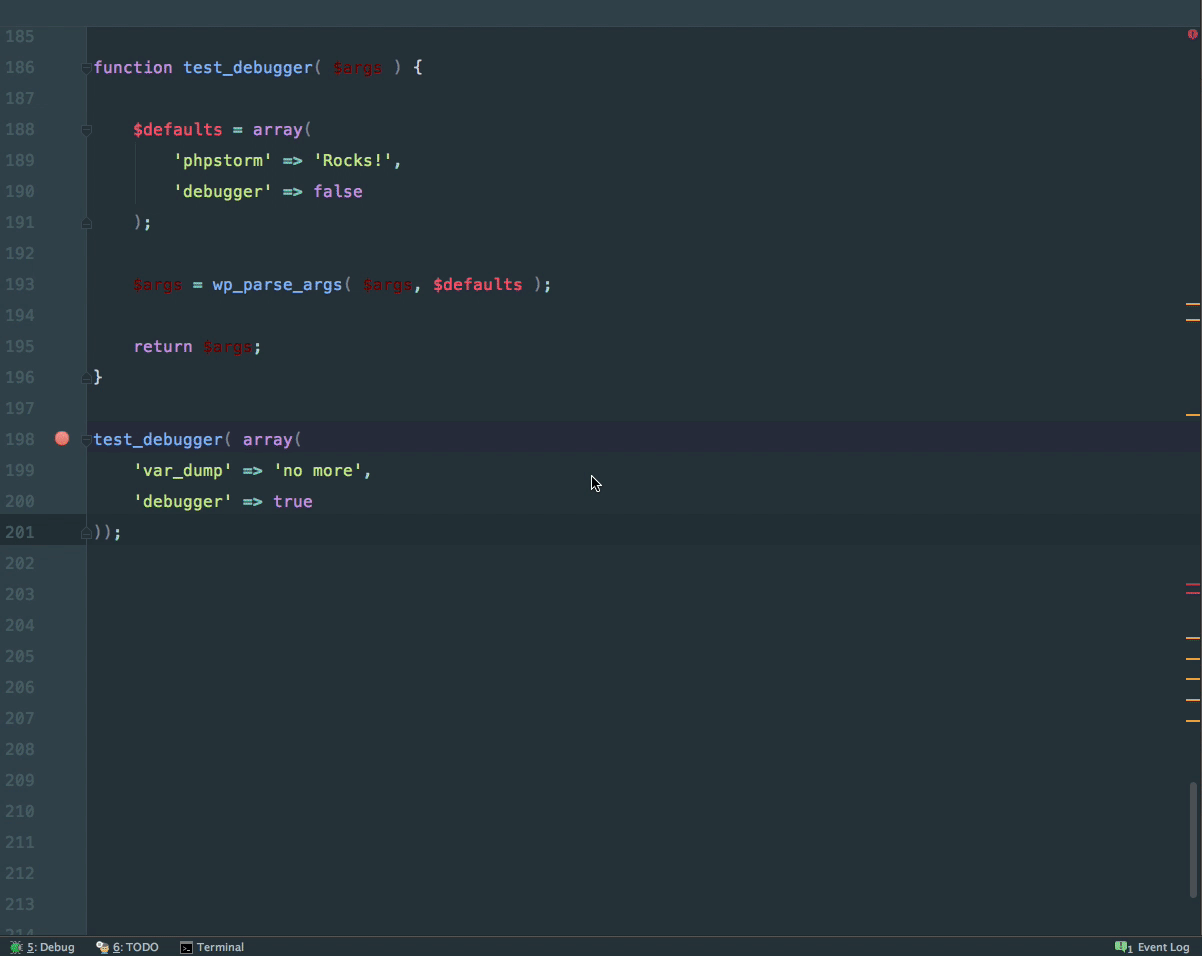
There is a lot going on in this gif, so let me point out a few key points.
- By pressing
^ (Control) + Dthe bottomDebugpane slides up. Then, I reload the page and PHPStorm kicks in where the breakpoint is set. - Notice the
Variablescolumn. It contains EVERY variable in scope at that time. - Then, I use the
Step Intobutton to go into thetest_debuggerfunction. - As I’m stepping through, you can see the values of variables directly to the right of them.
- Did you also catch that we stepped into the
wp_parse_args()? Pretty cool stuff! - Finally, we can see in the
Variablescolumn that$argsis set to the arrays that were merged.
Wrapping Up
A lot has been covered in this post and there is so much more that could be written about the different features the debugger provides. However, I think its best we save that for another post!
I’d also like to thank Kellen for sharing his knowledge with me on this subject.
If you find yourself getting stuck or not being able to get the debugger configured, please feel free to leave a question or comment below!