Introduction
Local by Flywheel is a popular tool for getting quick and reliable WordPress installations running on your computer. One of its lesser-known features is the inclusion of xdebug support. xdebug is a PHP extension that allows for real-time debugging of PHP code. Today, we’re going to go over how to get both of these working together within vim to provide a powerful interface that allows for some successful debugging of WordPress.
Prerequisites
Firstly, this tutorial is intended for users of vim or neovim. If you aren’t familiar with how to use vi-like editors, but want to learn, I would recommend running vimtutor in your command line and learning how to move and work in vim before continuing with this post.
Next, you’ll need Local by Flywheel. You can download it here. If you haven’t set up a site before with Local, it is pretty straightforward. You can find a guide for getting started on Flywheel’s blog.
Setup
vim
For vim or neovim, henceforth referred to simply as “vim” (with distinctions for neovim if necessary), you will need the Vdebug plugin. Installation instructions are included on the plugin’s page. I use vim-plug to manage plugins; so my .vimrc looks like this:
""" Vim-Plug
call plug#begin()
Plug 'vim-vdebug/vdebug'
call plug#end()
After adding Vdebug, we’ll need to add some configuration. Before we continue, let’s get Local configured for xdebug.
Local and xdebug
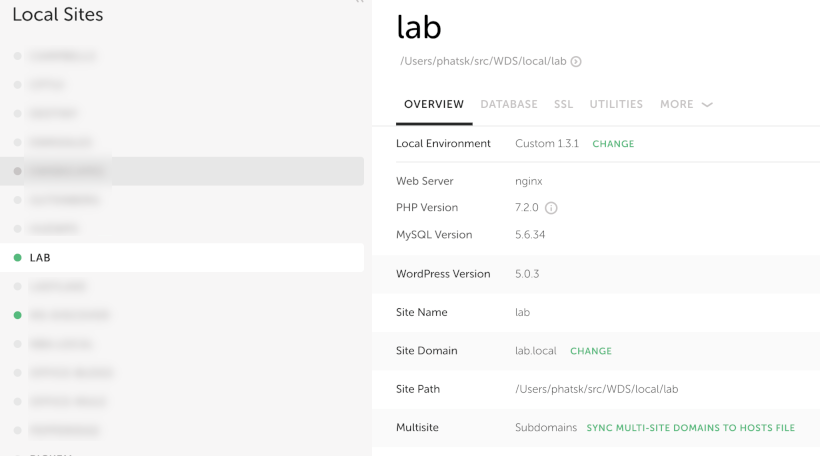
Local ships with the xdebug extension available but not enabled. Each site that you want to debug will need its configuration altered to work with debugging. First, find your Local site site’s directory. In Local, you can view this on the Overview tab, under “Site Path.”
Open your site’s directory, and find the file conf/php/<your site's PHP version>/php.ini. Open this file with any text editor and find the section titled [Xdebug]. This contains the relevant configuration we’re looking for. After modifying this section, your section should look similar to:
xdebug.remote_enable=1
xdebug.remote_connect_back=On
xdebug.remote_port="9000"
xdebug.profiler_enable=1
xdebug.remote_autostart=true
xdebug.remote_handler=dbgp
xdebug.remote_mode=req
xdebug.remote_host=<your local IP>
Note that the remote_host argument should be your computer’s local IP. This will allow the Local machine to talk to your editor.
Save your modifications, and restart your site in Local.
Configuring vim
Open your vim configuration file. Typically, for vim, this will be ~/.vimrc, in NeoVim, your configuration is usually in ~/.config/nvim/init.vim. Add a new section to your vimrc that looks like this:
let g:vdebug_options= {
    "port" : 9000,
    "server" : '',
    "timeout" : 20,
    "on_close" : 'detach',
    "break_on_open" : 0,
    "ide_key" : '',
    "path_maps" : {
        '/app/public/': '<path to your project public folder>'
    },
    "debug_window_level" : 0,
    "debug_file_level" : 0,
    "debug_file" : "",
    "watch_window_style" : 'compact',
    "marker_default"     : '⬦',
    "marker_closed_tree" : '▸',
    "marker_open_tree" : '▾'
}
Note that you need to fill in the path_map item with your local project’s public folder. If your project is located in /Users/you/Local/myproject/, your public folder would be in /Users/you/Local/myproject/app/public/. Also note that the left-hand side points to /app/public/. This is where Local’s server stores your public files. The right-hand side points to the location of the files as you see them in your filesystem.
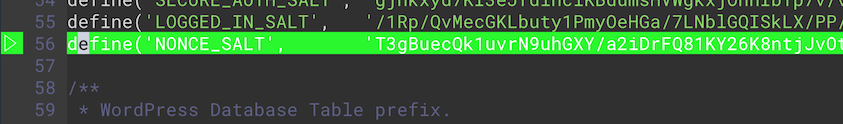
Now, save your vim configuration and restart vim (you can probably source the configuration, but Vdebug can be a little weird sometimes). Open a file in your project. Let’s try wp-config.php to start. Find a line with code before wp-settings.php is included and press <F10> on your keyboard.
The line should change color. In my editor, it shows a green line where I set the breakpoint:
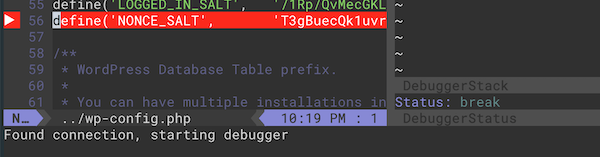
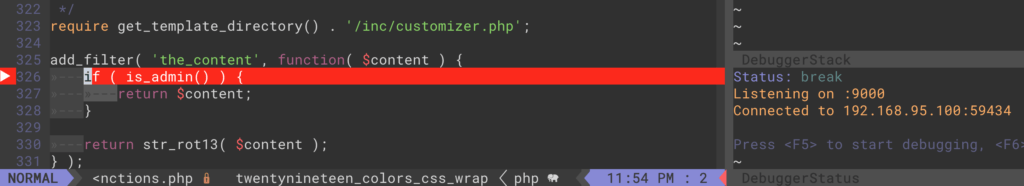
Now, press <F5> and you should see a message in the status line saying that “Vdebug will wait for a connection in the background.” Visit any page in your site, and you should see Vdebug connect and pause on the line you set as a breakpoint:
Troubleshooting
Here are some tips if you’re having trouble with Vdebug:
- If the debugger is attaching and then stopping, verify the
path_mapsconfiguration. - If the debugger is not attaching, verify your
Xdebugconfiguration in yourphp.ini.
Working with the Debugger
Author note: the following code takes place in the twentynineteen theme. The premise of this exercise is ridiculous, and meant to be an example of how to use the debugging functionality.
Vdebug includes a number of default key mappings, as well as some commands to help evaluate your code. Open your theme’s functions.php and add the following:
add_filter( 'the_content', function( $content ) {
    if ( is_admin() ) {
        return $content;
    }

    return str_rot13( $content );
} );
Now, travel to a single post on your site’s frontend, and view a post:
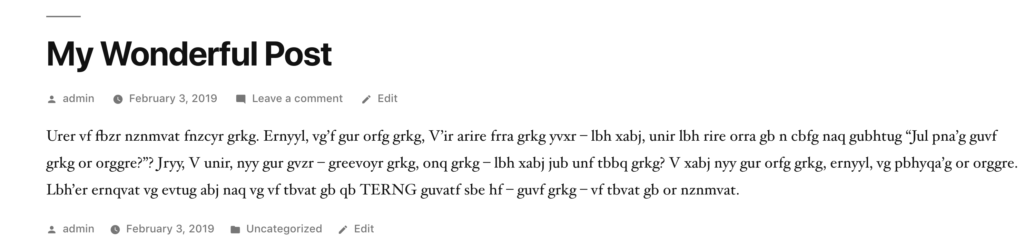
Whoops, seems something has gone wrong! Let’s suppose this code is buried somewhere deep in our included files; it could be a pain to find the source of this issue. With xdebug, we can trace the code back to our bad filter—the one that we “totally don’t know about…”

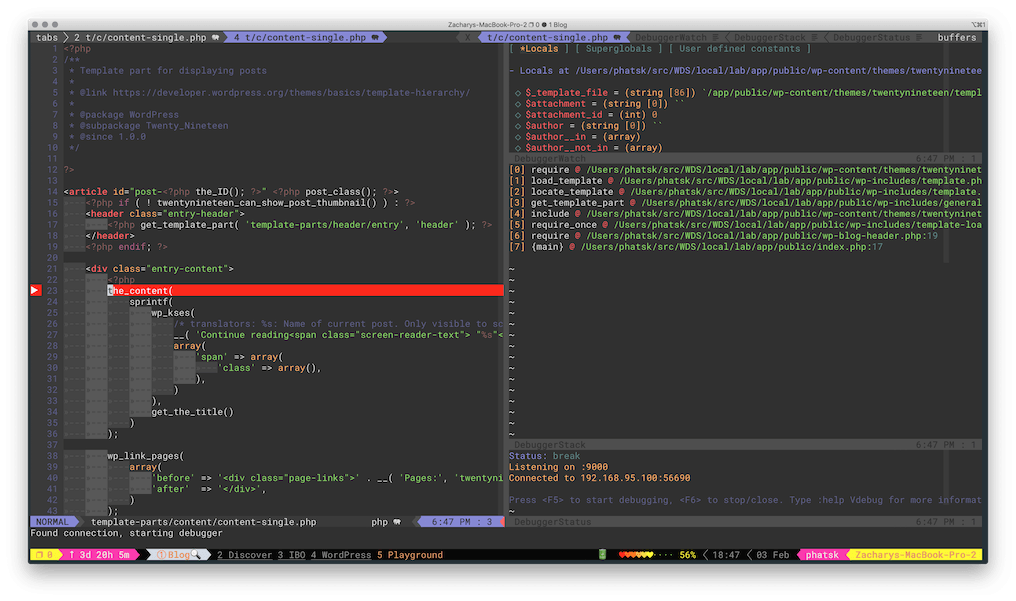
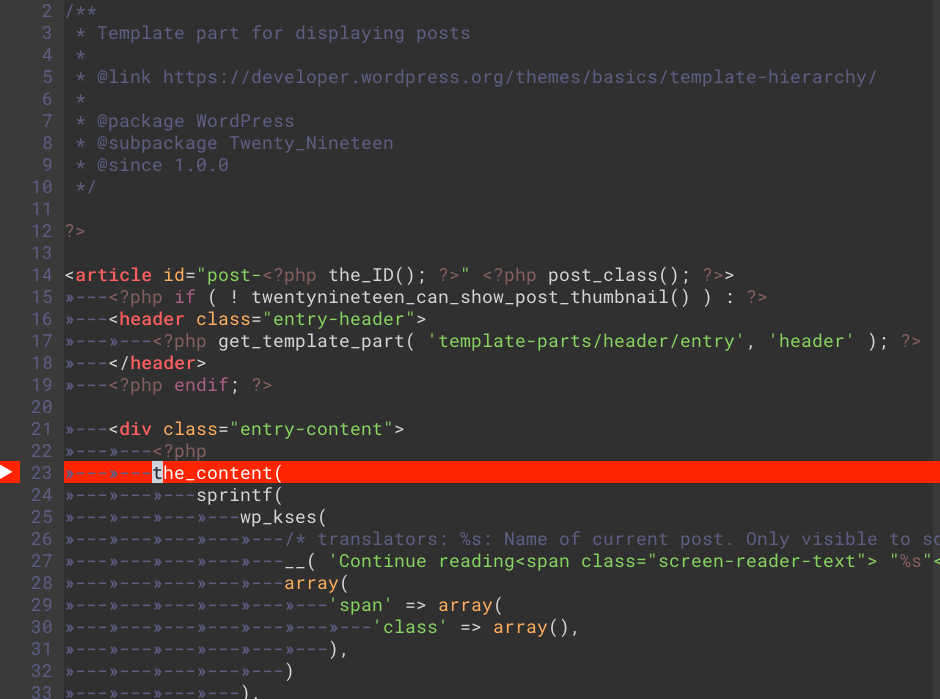
First, open up template-parts/content/content-single.php, and find the line calling the_content:
23         the_content(
24             sprintf(
25                 wp_kses(
26                     /* translators: %s: Name of current post. Only visible to screen readers */
27                     __( 'Continue reading<span class="screen-reader-text"> "%s"</span>', 'twentynineteen' ),
28                     array(
29                         'span' => array(
30                             'class' => array(),
31                         ),
32                     )
33                 ),
34                 get_the_title()
35             )
36         );
Since we know our issue is in the content being output, move your cursor on the line with the call to the_content and press <F10> on your keyboard. The line should highlight to indicate that you have set a breakpoint.
Before continuing, it’s a good time to review some of Vdebug‘s key mappings from the Quick Guide section of the README:
<F5>: start/run (to next breakpoint/end of script)
<F2>: step over
<F3>: step into
<F4>: step out
<F6>: stop debugging (kills script)
<F7>: detach script from debugger
<F9>: run to cursor
<F10>: toggle line breakpoint
<F11>: show context variables (e.g. after "eval")
<F12>: evaluate variable under cursor
:Breakpoint <type> <args>: set a breakpoint of any type (see :help VdebugBreakpoints)
:VdebugEval <code>: evaluate some code and display the result
<Leader>e: evaluate the expression under visual highlight and display the result
We will primarily be focused on <F5>, <F3>, <F4>, <F9>, and <F10>. Remember, if you get lost, you can always press <F6> to quit the debugger and then start again.
Next, to start the debugger, press <F5>. You should see the following message in your status line: “Vdebug will wait for a connection in the background.” Reload the page in your browser and you should be presented with the debugging window.
The debugger should halt on our breakpoint. From here, we’ll want to “step into” the function calls to decipher what’s going on using <F3>. When we first step in, you’ll notice we’re not inside the_content, but __. What’s going on? PHP executes methods from the innermost function call to the outermost. Since our breakpoint is actually on a set of nested function calls, we’ll need to press <F4> to step out” of each function until we get to the_content:
Once we’re in the content, we can see a call to apply_filters. Knowing how WordPress works with Actions and Filters, it’s a safe bet that our content is being modified in a filter. Move your cursor to the line calling apply_filters, and press <F9> to allow the program to run until we get to that line.
Next, press <F3> to step into apply_filters. I’ll tell you, this function is a little confusing. We just want to worry about the line that actually calls the filter methods:
$filtered = $wp_filter[ $tag ]->apply_filters( $value, $args );
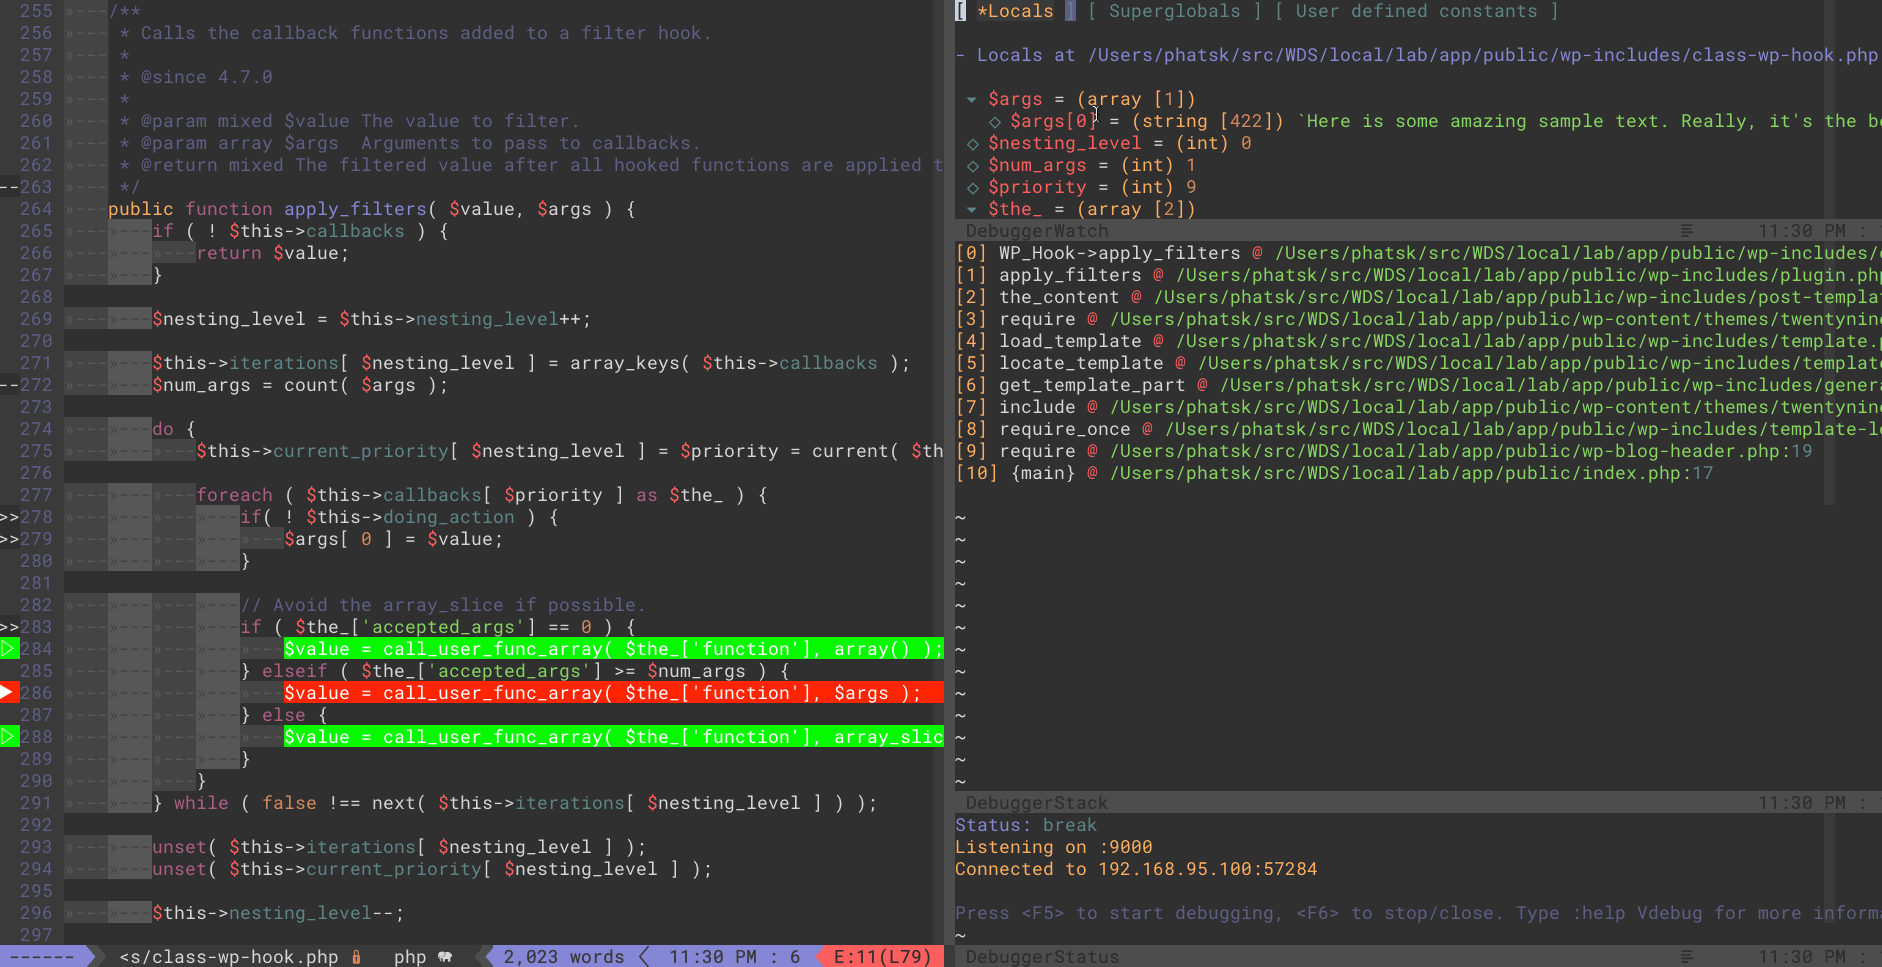
Put your cursor on that line and press <F9> again, and then “step in” with <F3>. As you enter the apply_filters method, bear in mind that the crux of WordPress hooks are callbacks. With that in mind, it’s safe to say the following lines are where the magic happens:
282                 // Avoid the array_slice if possible.
283                 if ( $the_['accepted_args'] == 0 ) {
284                     $value = call_user_func_array( $the_['function'], array() );
285                 } elseif ( $the_['accepted_args'] >= $num_args ) {
286                     $value = call_user_func_array( $the_['function'], $args );
287                 } else {
288                     $value = call_user_func_array( $the_['function'], array_slice( $args, 0, (int)$the_['accepted_args'] ) );
289                 }
Lines 284, 286, and 288 all use call_user_func_array in some form or fashion. Place your cursor on each line and press <F10> to add a breakpoint, and then hit <F5> to continue execution. The debugger will begin breaking on one of those three lines.
The Watch Window
Vdebug displays a window where you can watch the variables that are available in various scopes. By default, the “Locals” scope is shown.
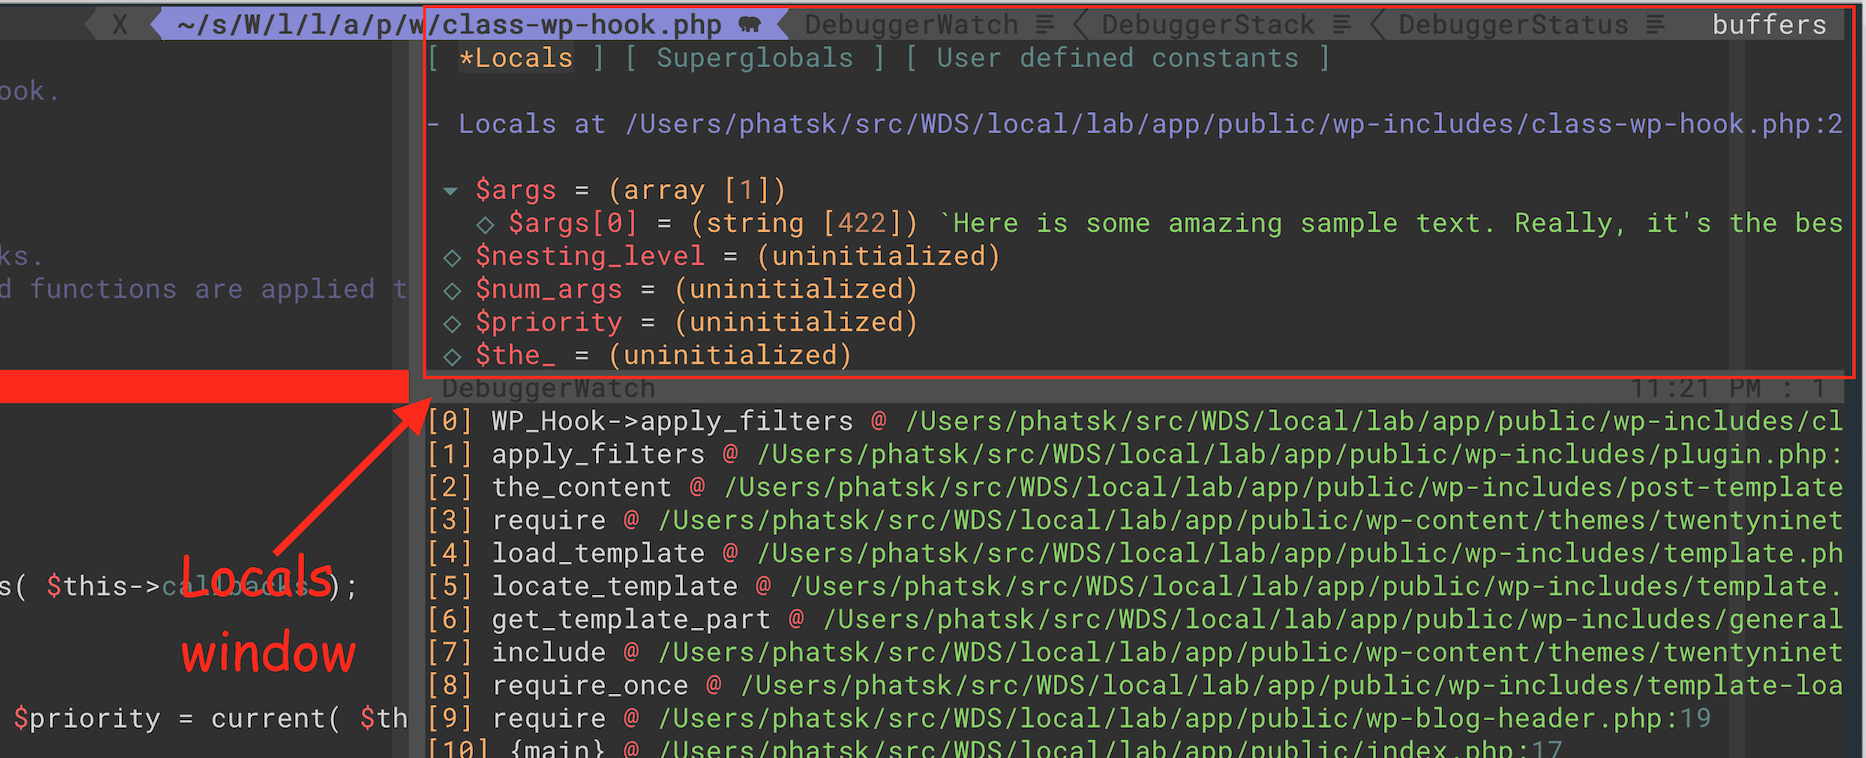
This is a window just like any other vim window. Move your cursor to the Locals window, and scroll down until you find the $the_ array (hint: you can search with normal vim commands); expand it by using the <Enter> key. Next, you should look at the value of $the_["function"]. Notice that this will either be an array or a string. Expand the array or view the string with each run of <F5>, looking for anything that may stick out as odd.
Did you find it? There’s a Closure. Since we can’t see what it does here, we’ll need to “step in” again with <F3>. The debugger now drops us into the offending method—the filter we added earlier calling str_rot13.
Wrapping Up
With this ridiculous example, I hope you are able to use xdebug in your own projects to effectively debug. Understanding the WordPress codebase is crucial to being an effective developer, and getting down and dirty with a debugger is a great way to learn how truly complex a system can be.
Tips
Vdebugcan be fickle – you may need to hit<F6>a couple of times to close the debugger completely.- Use
:help Vdebugand read the documentation to learn about things like<leader>e. - Use project-specific .vimrc files to set up your
Vdebugpaths:
In the following examples, use .vimrc for vim and init.vim for neovim:
" In your ~/.vimrc or ~/.config/nvim/init.vim
set exrc " see :help exrc

" At the BOTTOM of your RC file:
set secure
This will allow you to set up a configuration for each project. vim with search for either .vimrc, _vimrc, or .exrc in your current directory and load it if found. For neovim, the file names are .nvimrc, _nvimrc, and .exrc. I tend to work from the wp-content folder to make use of tags for my plugins and themes. Depending on where you start your editing, place your RC file in the appropriate location and add your vdebug_options configuration in there. Here’s mine in ~/src/WDS/local/lab/app/public/wp-content/.nvimrc:
" Local 'Lab' {{{
let g:vdebug_options= {
    "port" : 9000,
    "server" : '',
    "timeout" : 20,
    "on_close" : 'detach',
    "break_on_open" : 0,
    "ide_key" : '',
    "path_maps" : {
        '/app/public/': '/Users/phatsk/src/WDS/local/lab/app/public/'
    },
    "debug_window_level" : 0,
    "debug_file_level" : 0,
    "debug_file" : "",
    "watch_window_style" : 'compact',
    "marker_default"     : '⬦',
    "marker_closed_tree" : '▸',
    "marker_open_tree" : '▾'
}
" }}}
Now, I don’t have to worry about resetting things in my init.vim whenever I switch projects!
Actual Conclusion
You made it! In this post you (hopefully) learned:
- How to enable
xdebugin your Local installations - Install the
Vdebugplugin forneo/vim - Effectively use
Vdebugto track down bugs in code.
Happy bug squashing!