Have you ever considered using a debugger for your React project but decided to keep on using console.log() instead because you thought it would be a pain to set up proper debugging?
I did, until one day, I needed to get into the weeds on a project, and I figured I’d try and set up debugging in hopes of making my life easier. I was delighted to find out how easy it was! In this post, I’ll demonstrate how to debug a React project using VS Code and Chrome.
To demonstrate how to set things up, I’m going to use Vite and React to set up a React project. You’ll need to have VS Code and NPM installed.
Set Up a Workspace in VS Code
First, create a directory for our workspace. Then Open the directory in VS Code. Save the workspace.
I used D:devtrainingdebugging-react.
Create a React Starter Project Using Vite
From VS Code, open up this location in the integrated terminal and run the following command to create a starter project: npm create vite@latest
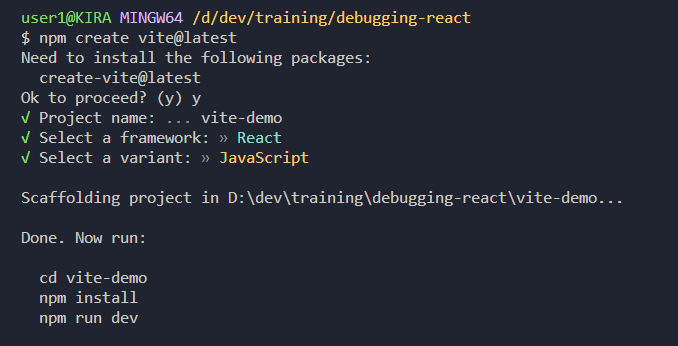
Follow the prompt from Vite. Give the project a name (I used vite-demo ). Select React for the framework and JavaScript for the variant.
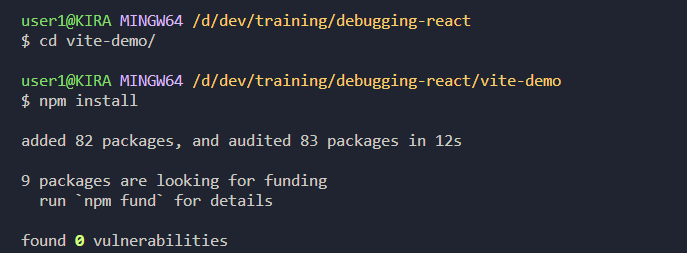
Once that’s all set, change directories into the project folder that you assigned, run npm install.
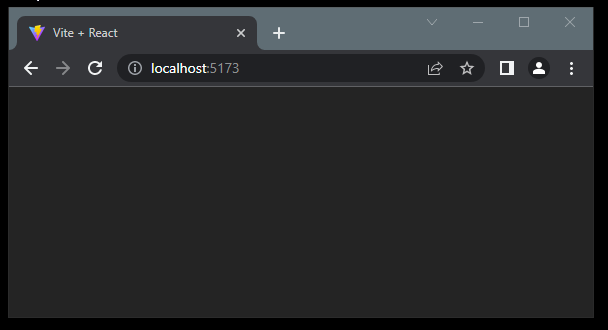
Once the installation is complete, start Vite by running npm run dev.
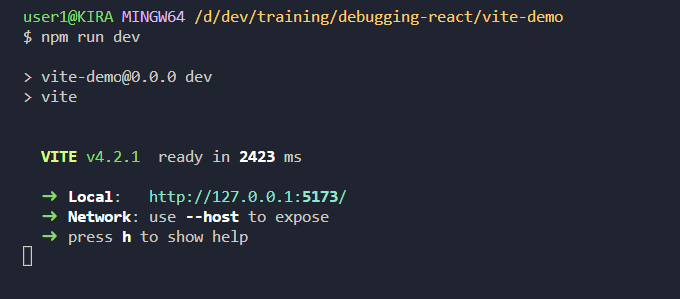
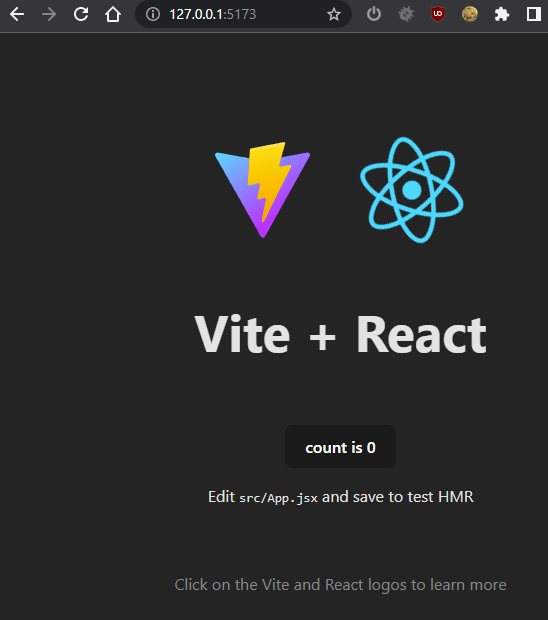
We can see that our project is running on localhost, port 5173. A browser window will be opened with the project:
Create and Configure a launch.json File in VS Code
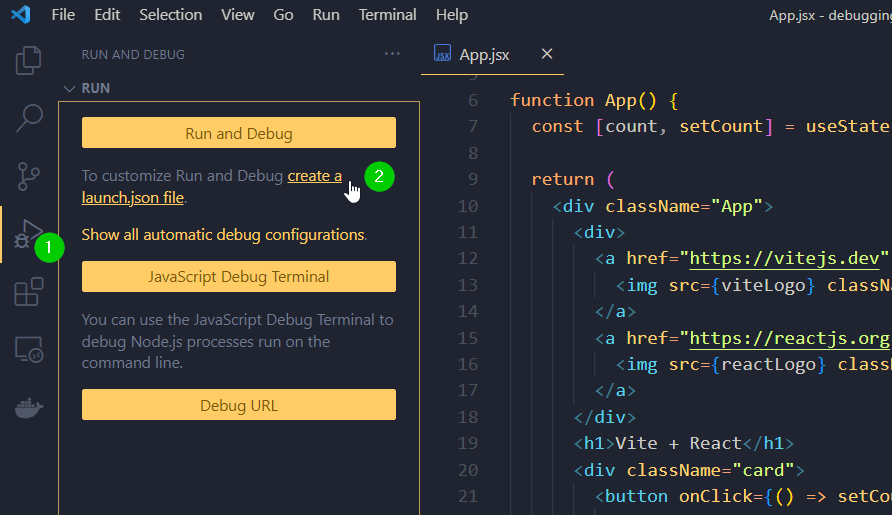
Now we need to create a launch.json file. Click the Debug icon (1), then create a launch.json file (2). The launch.json file will be located in your workspace’s .vscode directory.
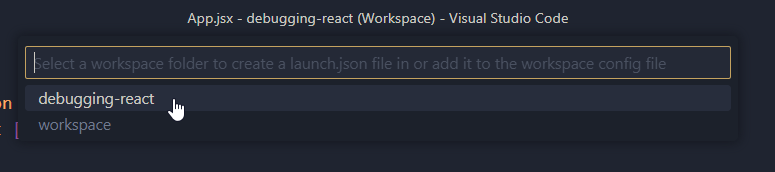
Select the location:
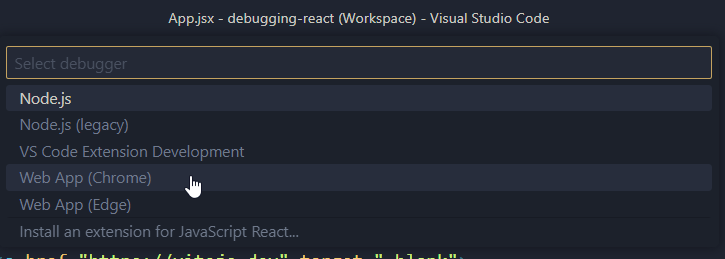
Select Chrome for the debugging type:
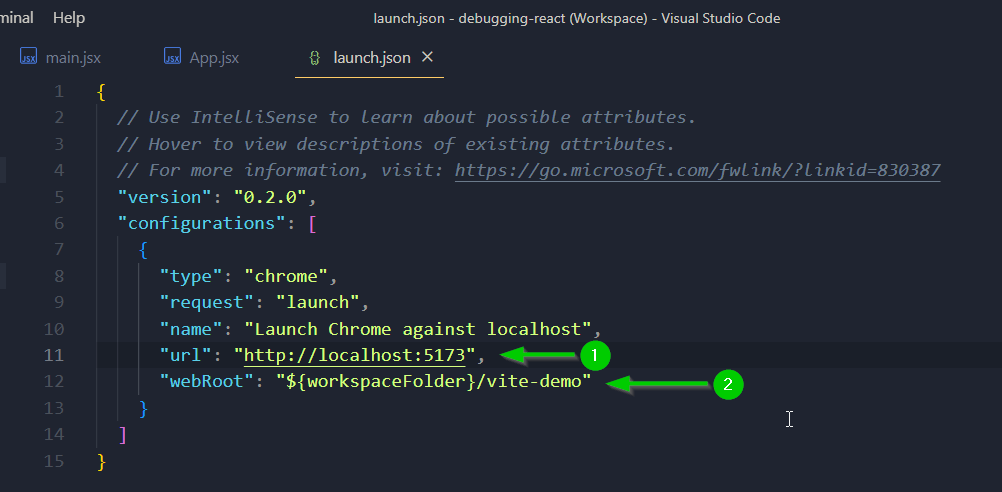
This will open the launch.json file in a tab. (1) Set the port to whatever was specified by Vite earlier (5173 by default), and (2) add the subdirectory your project is into the webRoot option if you have your project in a subdirectory like I do here (/vite-demo).
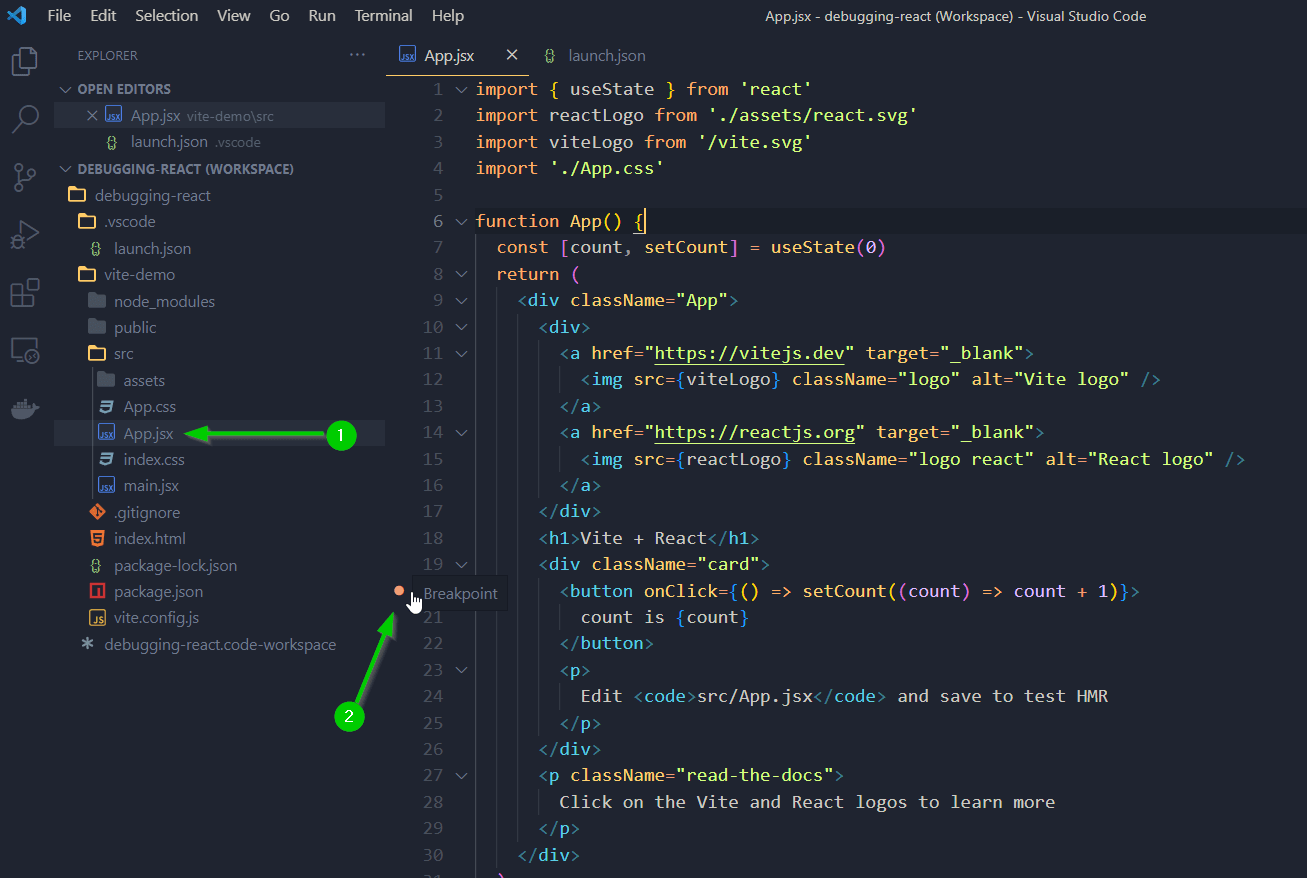
Add a Breakpoint to the Code
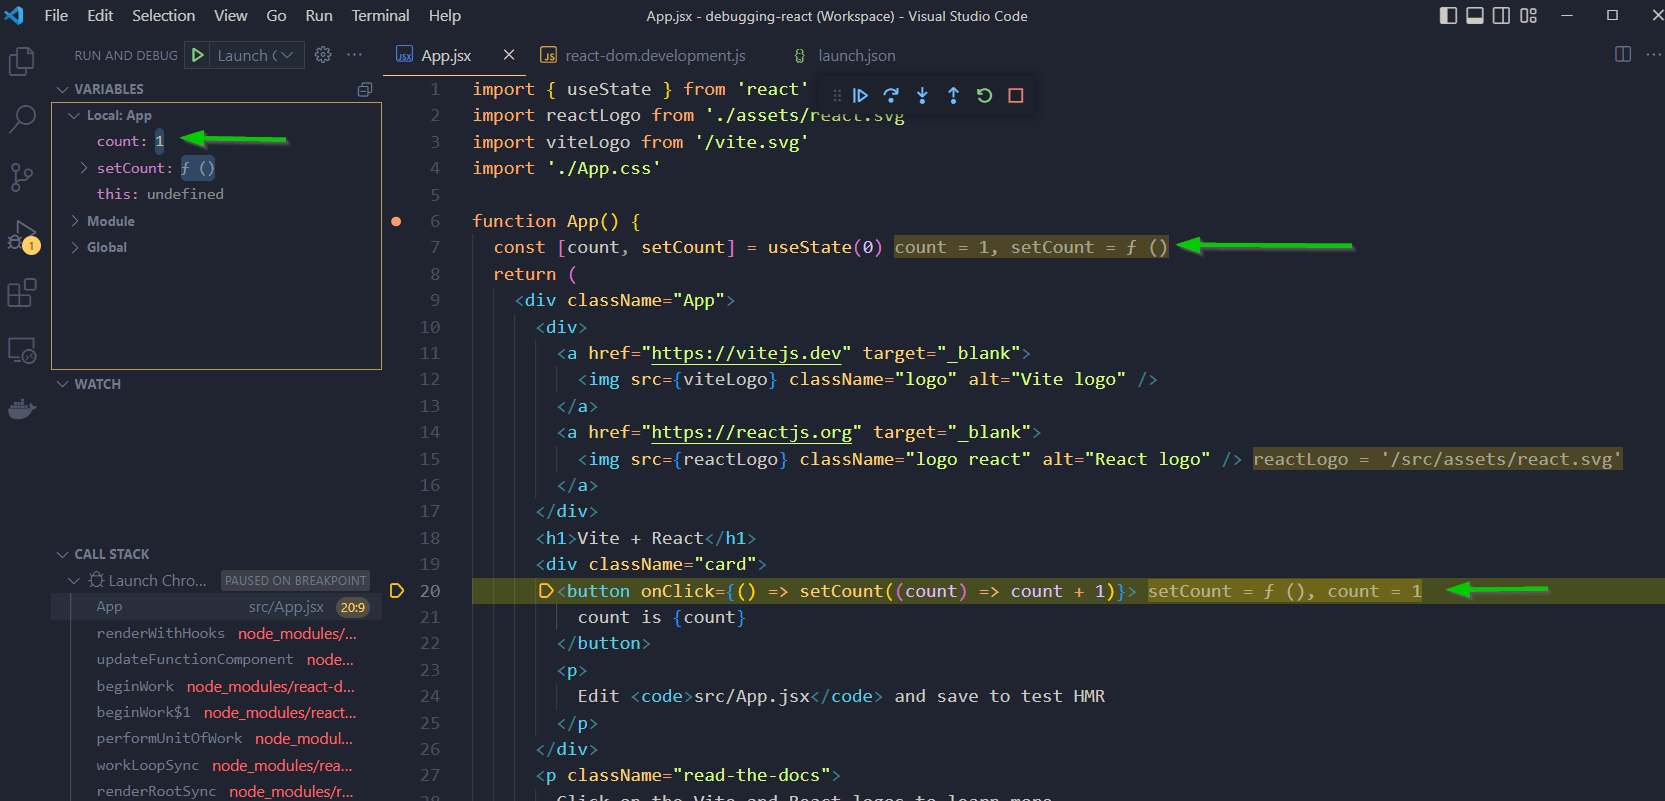
Now open up your project’s src/App.jsxfile (1) and (2) add a breakpoint to line 20. We’re going to debug the count variable.
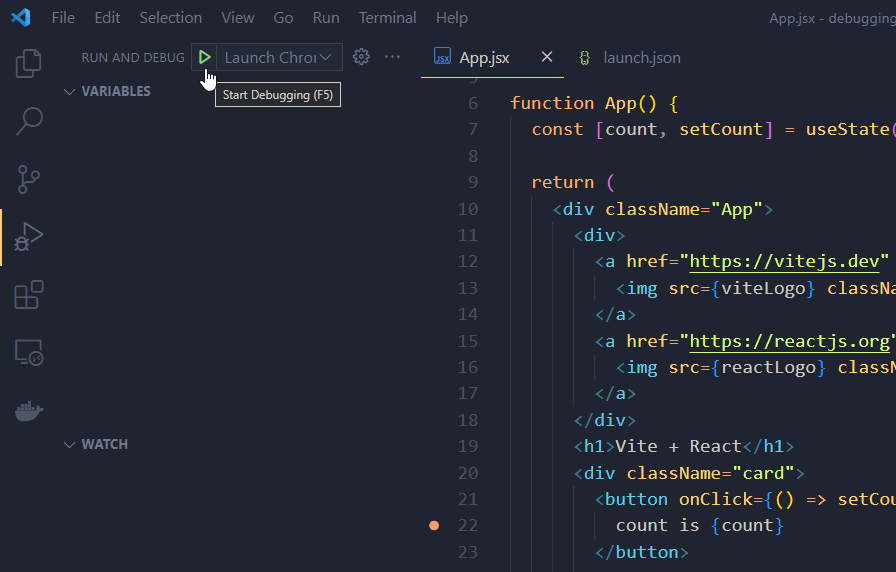
Start Debugging Your React Project!
OK, we’re getting close! Now click the Start button to start debugging. This will launch our app in a new Chrome window.
The app is paused for debugging.
A debugging session is now active in VS Code. We can use the debugging control bar to step through and inspect the code.
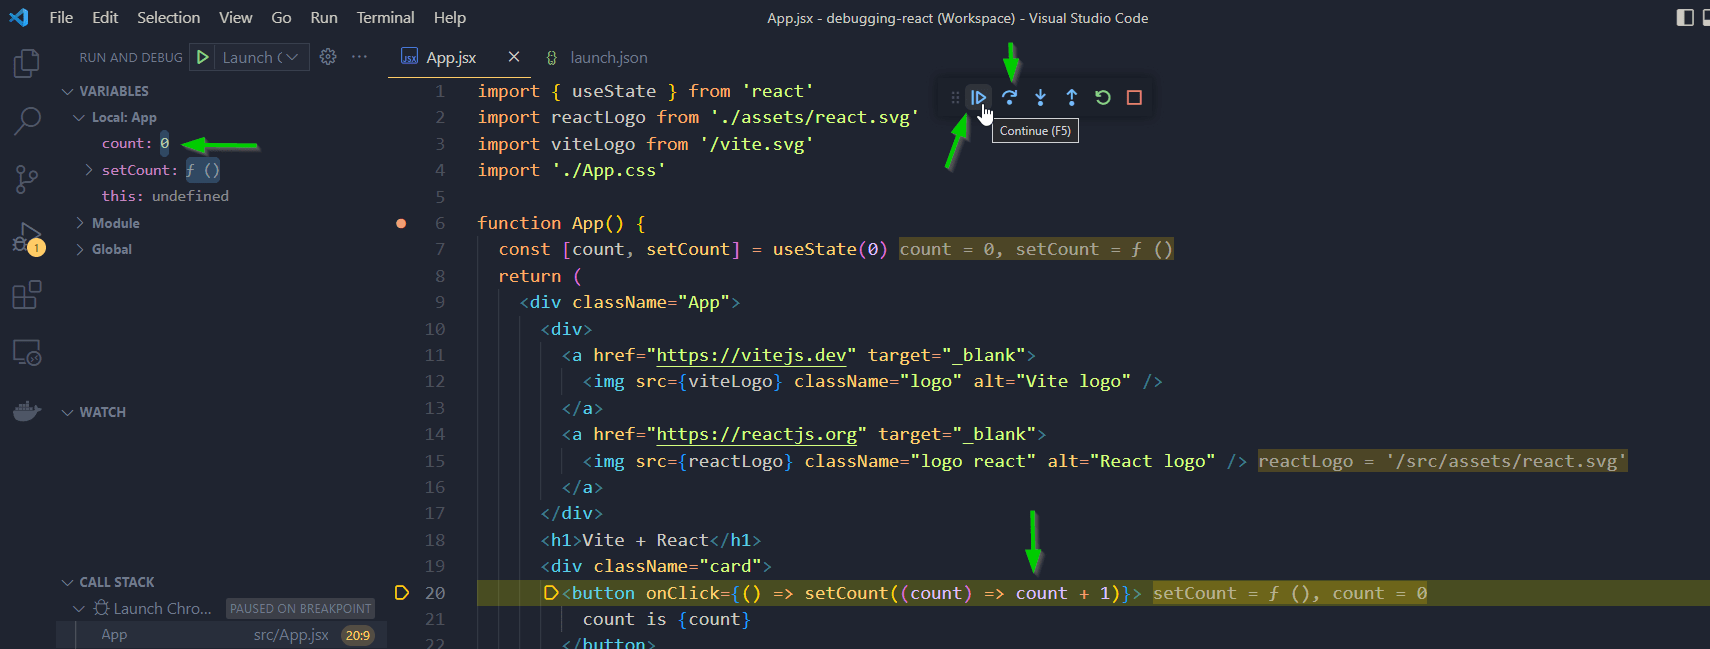
We can interact with the app and see the value of the counter increase after clicking the count button.
Here’s a quick screen capture showing this in action:
One thing to note is that, by default, React.StrictMode is enabled in dev mode, so your app will be run twice. See the docs for details on Strict Mode.
That’s all there is to setting up basic React debugging in VS Code and Chrome. I hope this helps you to more efficiently debug your React projects.
Are you struggling with WordPress security? Our free guide teaches you everything you need to know to protect your site. Download and read our “Guide to WordPress Security” to safeguard your website.