This post covers debugging WordPress using Xdebug, Local, and VS Code. This approach to debugging is far superior to logging variables to the error log or to the screen.
Getting things set up correctly can be tricky. That’s where this tutorial helps.
Xdebug
Xdebug is a powerful tool for debugging PHP applications. It conveniently comes bundled with Local.
We’re using VS Code for our code editor in this tutorial, as well as some other tools I’ve listed below. Everything included here is the current release and version numbers are noted just in case it might be helpful since things change.
Prerequisites
- Local v6.4.2+6012: A local WordPress development environment, formally known as Local by Flywheel
-
- PHP v7.4.1/v7.3.5/v8.0: Selectable via the Local UI. Choose v7.4.1 or v 7.3.5 for now because PHP 8 has a different Xdebug setup we’ll cover at the end of the article.
-
- VS Code v1.70.2: Code editor
- PHP Debug by Xdebug for VS code v1.27.0: VS Code extension which allows VS Code to talk to Xdebug
- Xdebug Helper browser extension: Used for explicitly enabling or disabling debugging sessions
I use Windows because that’s what makes me happy, but this guide applies to other environments as well. I just wanted to note that, since the paths I’ll be referencing are Windows-y.
Create a Site in Local
Once all of the prerequisites have been installed and activated, you’ll need to create a new WP site in Local if you don’t have one already. When PHP Versions 7.3.x or 7.4.x are selected in Local, Xdebug Version 2 is used.
When PHP Version 8 is selected, Xdebug Version 3 is used. We’re going to use PHP Version 7.4.1 to start off with and will cover PHP Version 8 at the end of the article.
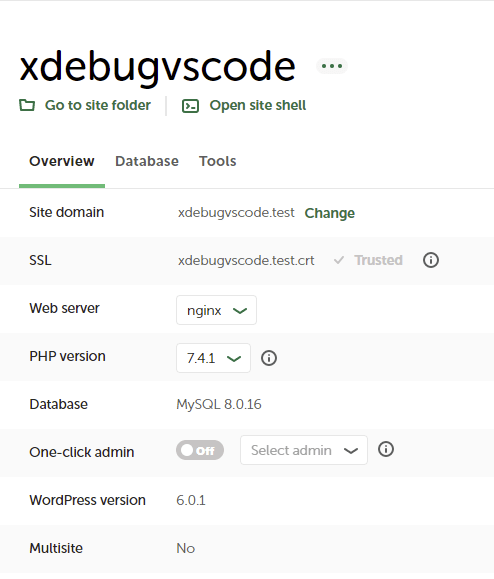
I’ve named my site xdebugvscode.test. Here are its settings:
Set Up php.ini.hbs Directives
Now that the site has been created, let’s double-check the Xdebug configuration directives in the site’s php.ini.hbs file. This file is located under your site’s conf/php directory.
For me, the path is D:devlocal-sitesxdebugvscodeconfphpphp.ini.hbs. Scroll to the bottom of the file under the [xdebug] section, and verify that you have the directives below set accordingly. If you need to make any changes, be sure to restart your Local site.
; Enable remote debugging.
xdebug.remote_enable=1

; If enabled, the xdebug.remote_host setting is ignored and
; Xdebug will try to connect to the client that made the HTTP request.
; It checks the $_SERVER['HTTP_X_FORWARDED_FOR'] and $_SERVER['REMOTE_ADDR'] variables to find out remote IP
xdebug.remote_connect_back=Off

; Set the port that Xdebug connects to.
xdebug.remote_port="9000"

; Disable the profiler.
xdebug.profiler_enable=0

; Set the profiler's output directory for when we're profiling.
xdebug.profiler_output_dir = "D:/dev/xdebug-profiler-output"
A Note About the php.ini.hbs File When Switching PHP Versions
If you ever change the PHP version for your Local site, Local will save the settings for the previous install of PHP under the {local-site-dir}/conf/php/php-{version-number}directory.
For example, I started out with PHP Version 7.4.1 installed, then switched to PHP Version 7.3.5. Local made a copy of my PHP Version 7.4.1 settings under D:devlocal-sitesxdebugvscodeconfphp-7.4.1.
If you change PHP versions and made any modifications to Local’s php.ini.hbs file, you’ll need to make the changes again, if this is the first time the PHP version has been activated. After that, if you swap between PHP versions, your setting changes will be preserved.
Ensure Xdebug Is Running
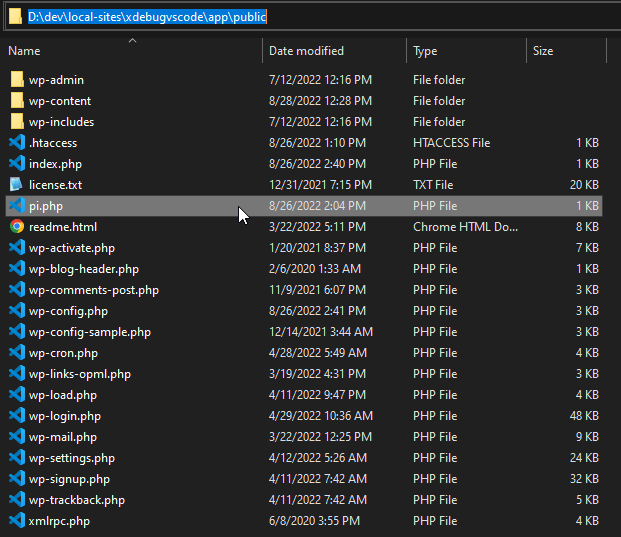
To make sure that Xdebug is running, create a file named pi.php in the root of your site and add the following code to it:
<?php
// Output information about PHP's configuration.
phpinfo();
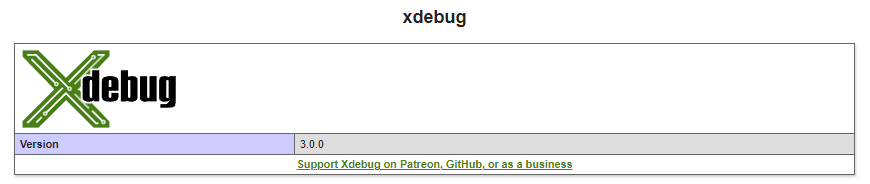
https://yoursite.test/pi.php and make sure that Xdebug is running. Find the Xdebug section; it will look something like this: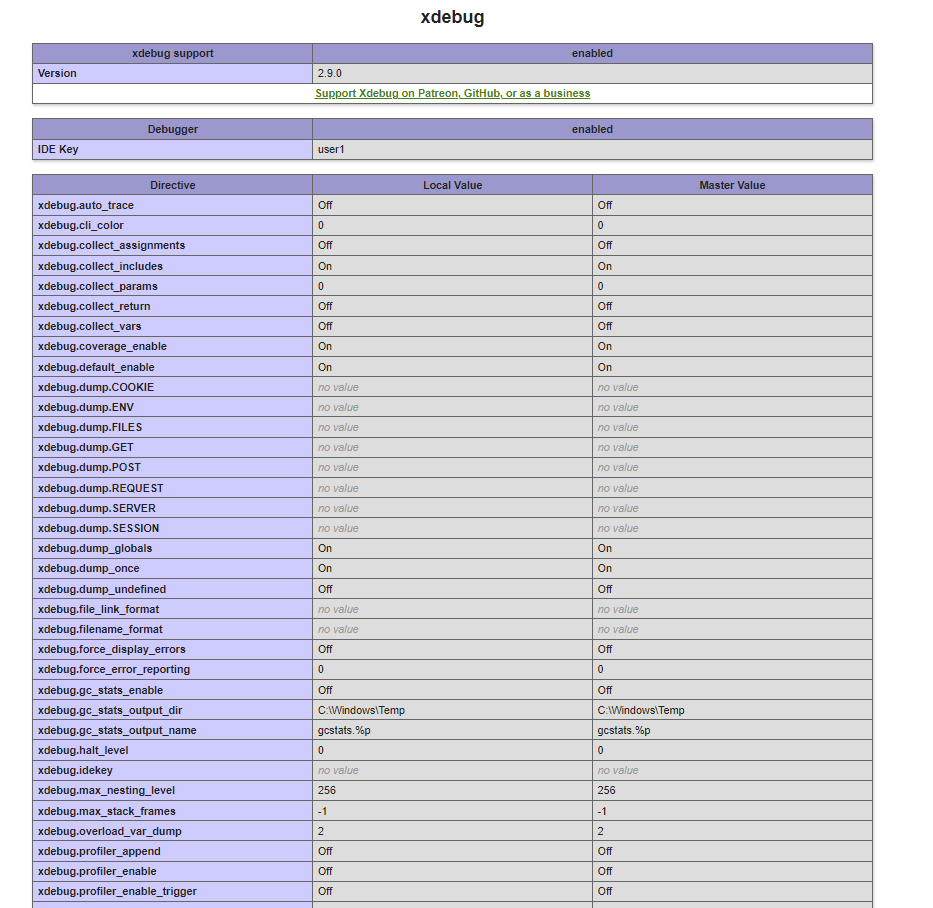
php.ini.hbs file to ensure that Xdebug is enabled.Activate Xdebug Helper Browser Extension
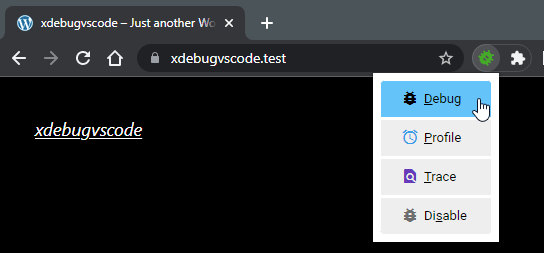
Once you’ve installed and activated the Xdebug Helper extension for your preferred browser, make sure to enable debugging by clicking on the icon and selecting Debug. The little bug icon will turn green letting you know that the browser extension will set the appropriate flag to turn on debugging.
Open Local Site in VS Code and Save a Workspace
Once the site has been created, go to File > Open Folder in VS Code, then navigate to the site’s directory. Now, save the workspace by going to File > Save Workspace As… and then give the workspace a name.
Install and Activate PHP Debug Extension for VS Code
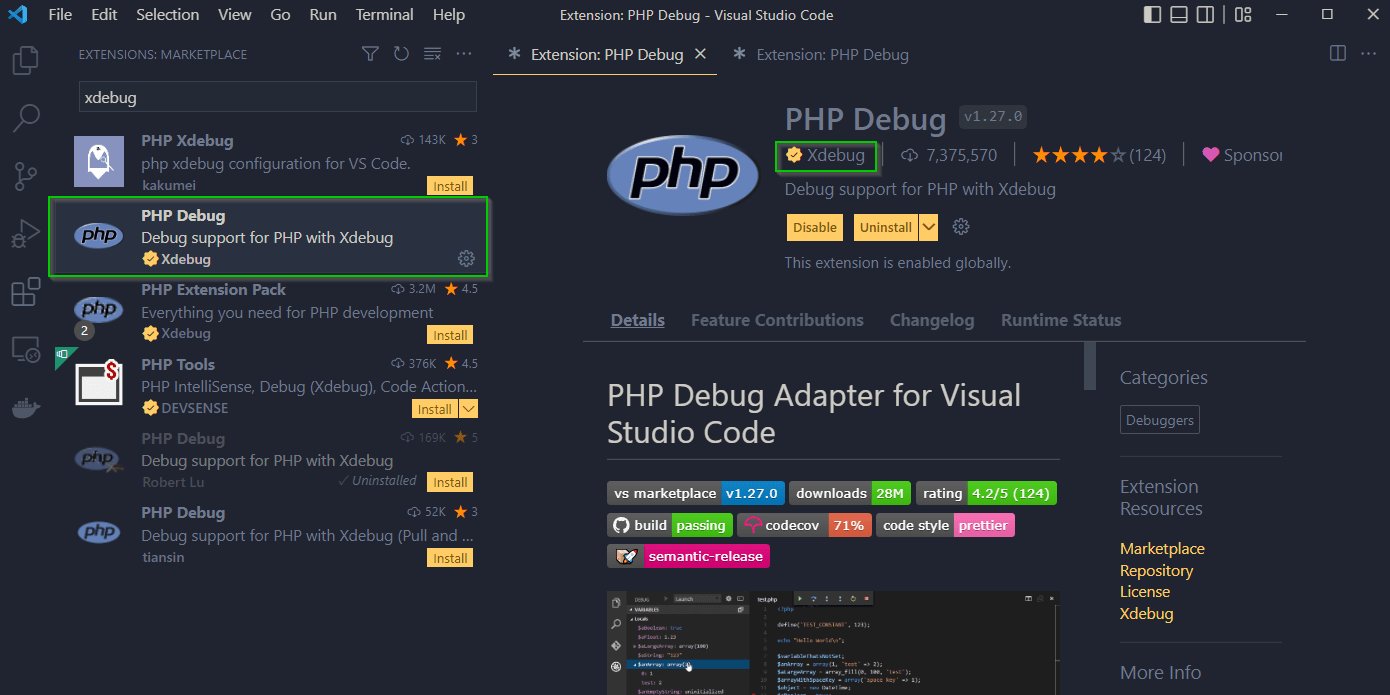
The PHP Debug extension for VS Code helps to bring everything together. Locate the extension in VS Code’s Extension Browser, and activate it. Make sure to select the one published by the Xdebug team, since there are a few extensions with the same name.
Create a launch.json File for Your Workspace
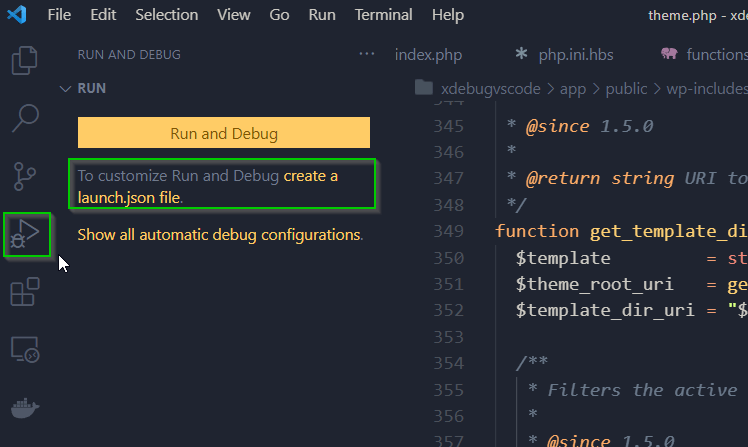
Next, we will create a launch.json file for our workspace. Click on VS Code’s debugging icon to open the debugging panel, then click on the create a launch.json file link.
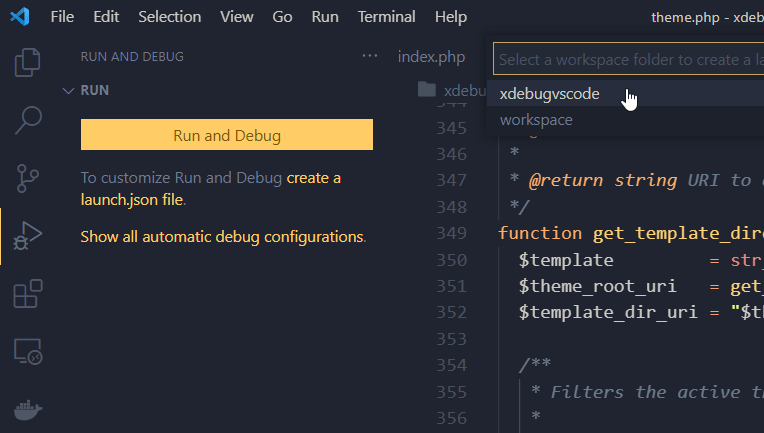
Now select the name of your workspace which you created earlier.
VS Code will populate the launch.json file with defaults, but we’re going to replace them.
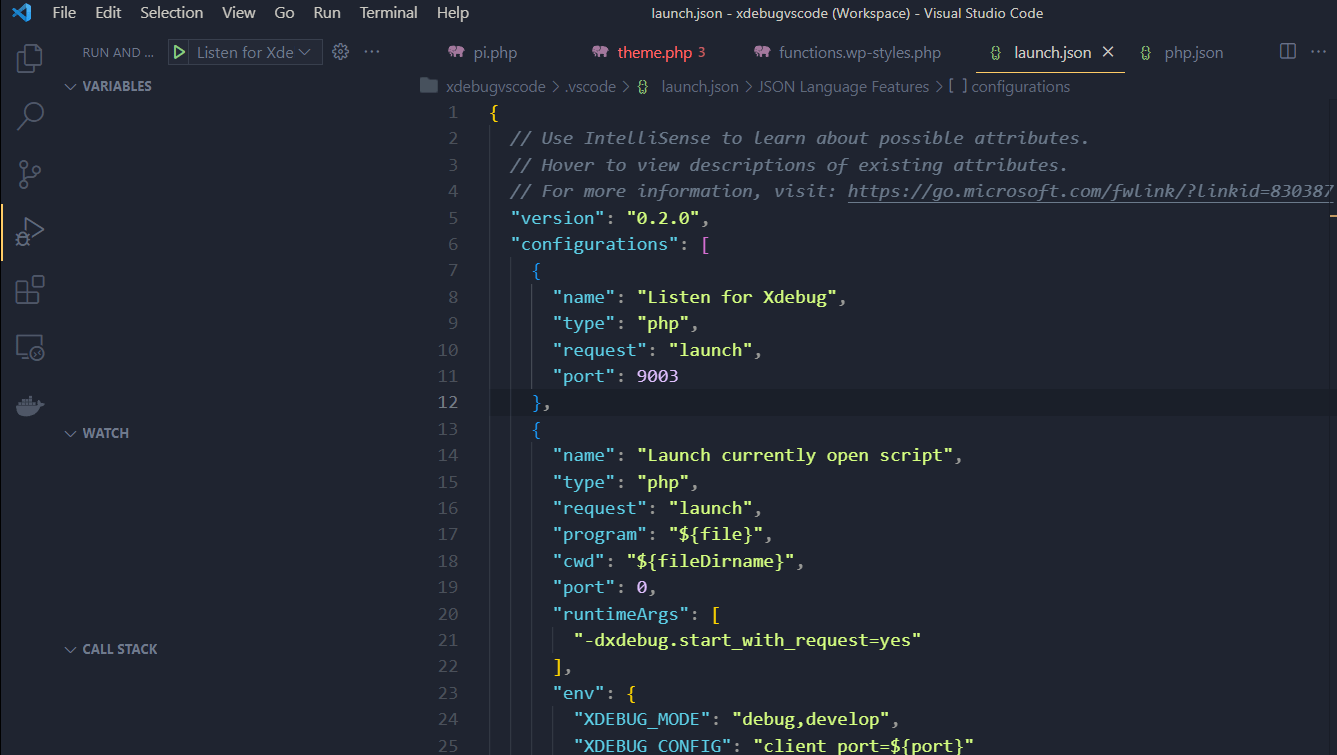
Go ahead and delete the entire contents of the default launch.json, replace the contents with the settings below, then save the file.
The launch.jsonwill be stored at {local-site-name}/.vscode/launch.json. So, mine is saved at D:devlocal-sitesxdebugvscode.vscodelaunch.json.
{
  // Use IntelliSense to learn about possible attributes.
  // Hover to view descriptions of existing attributes.
  // For more information, visit: https://go.microsoft.com/fwlink/?linkid=830387
  "version": "0.2.0",
  "configurations": [
    {
      "name": "Listen for Xdebug",
      "type": "php",
      "request": "launch",
      "port": 9000,
      "log": false,
      "maxConnections": 1, // @see  https://github.com/xdebug/vscode-php-debug/issues/604
      "xdebugSettings": {
        "resolved_breakpoints": "0", // @see https://github.com/xdebug/vscode-php-debug/issues/629 and https://stackoverflow.com/a/69925257/3059883
        "max_data": 512,
        "show_hidden": 1,
        "max_children": 128
      }
    }
  ]
}
When using Local’s PHP Version 7.3.x or 7.4.x, the version of Xdebug in use will be 2.9.0, which had a bug that caused some weirdness with breakpoints. I’ve added some links to the config file above which go into some more detail if you’re interested.
Check out the PHP Debug extension’s Github page for more information about supported settings.
Add a Breakpoint to Your Code
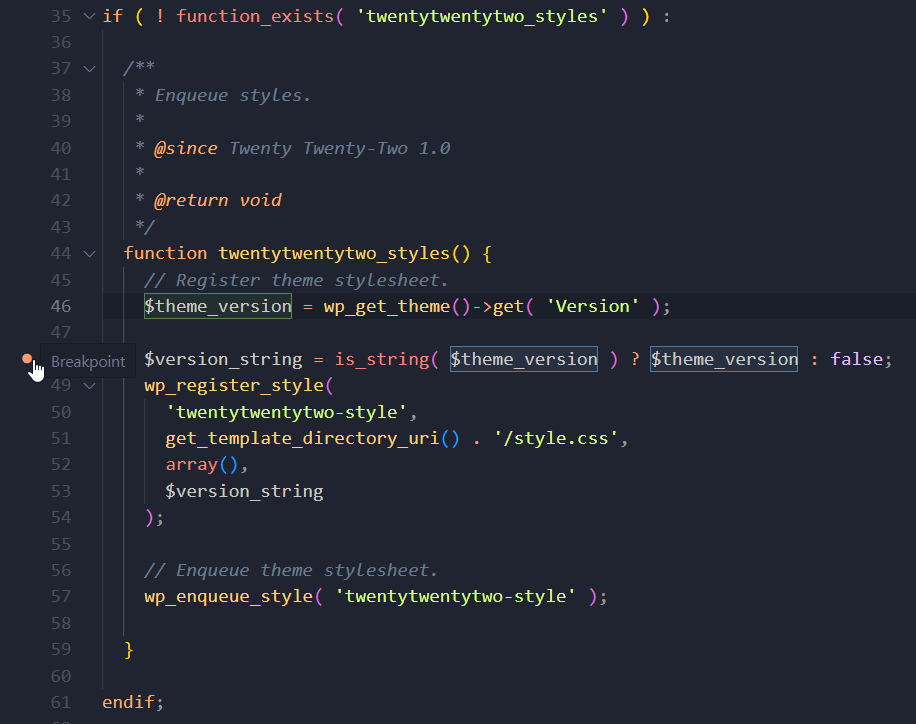
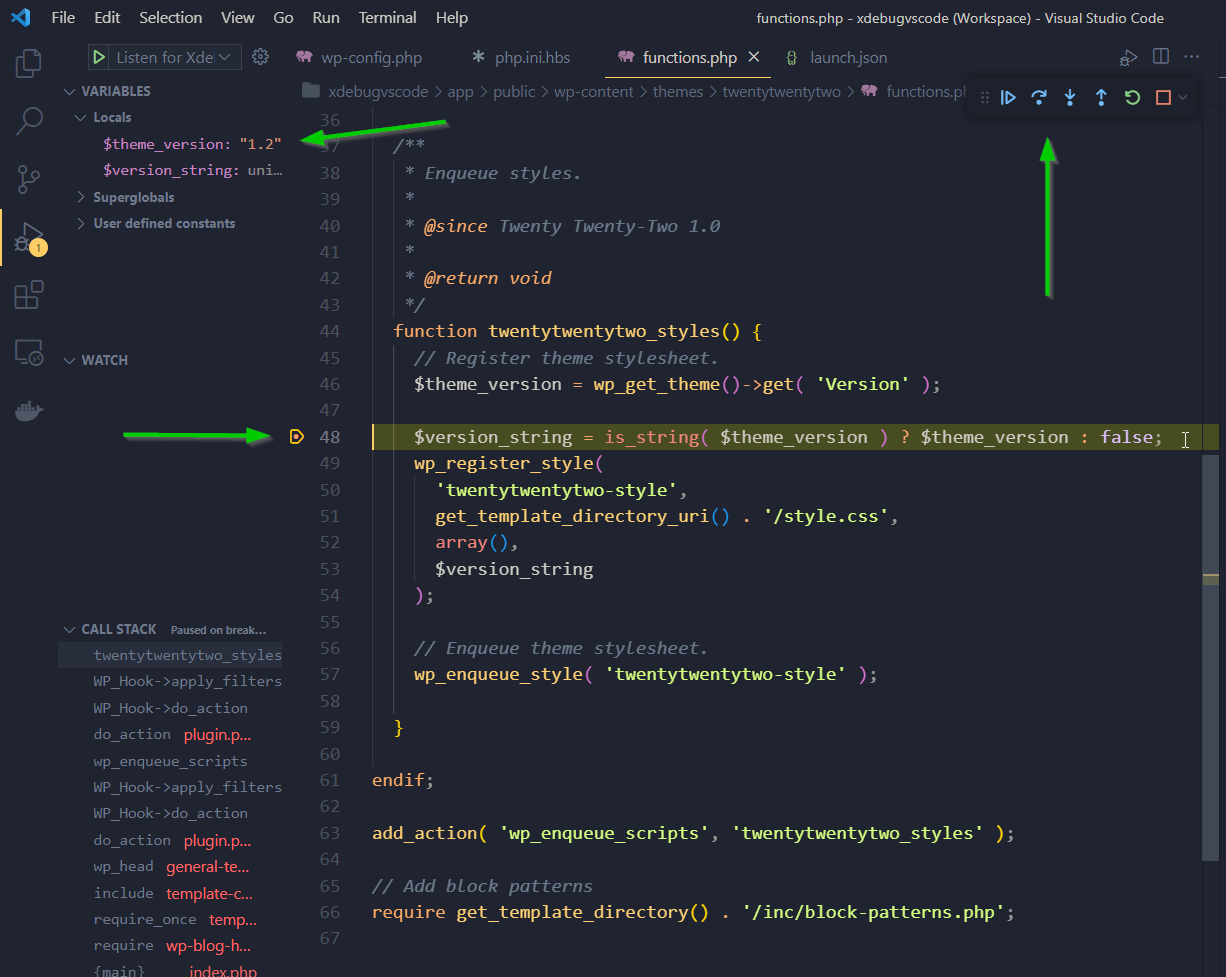
For the purposes of this debugging WordPress demo, I’m going to add a breakpoint to line 48 of Twenty Twenty-Two’s functions.php file.
To add a breakpoint, hover over the gutter (just to the left of a line number) and a little orange dot will appear. Click it to add a breakpoint.
Click it again to remove it. You can add multiple breakpoints, and the debugger will stop on each one. To keep things simple here, I’ll just add the one.
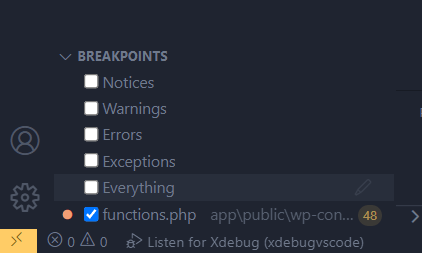
Once your breakpoint has been added, you will see it listed in the lower left-hand corner of VS Code’s debugger panel. It’s also possible to set breakpoints on Notices, Warnings, Errors, etc., but we’ll uncheck all of those for this example.
Start Debugging WordPress
We’re finally ready to start debugging WordPress! Open VS Code’s debugger panel and click the green triangle to start listening for Xdebug. Use the F5 shortcut.
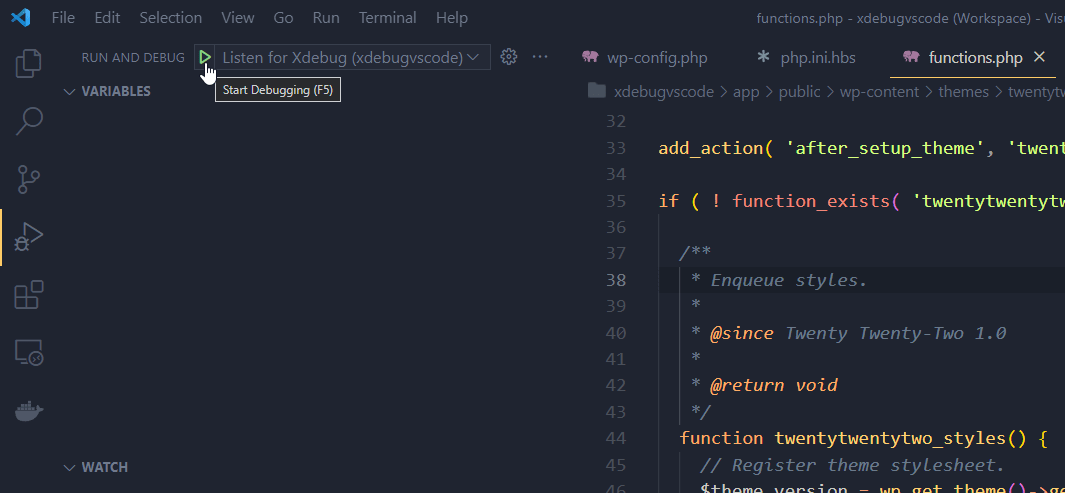
Once VS Code is listening for Xdebug, the Debugger Controls window will be displayed. The bottom of the VS Code window will turn orange.
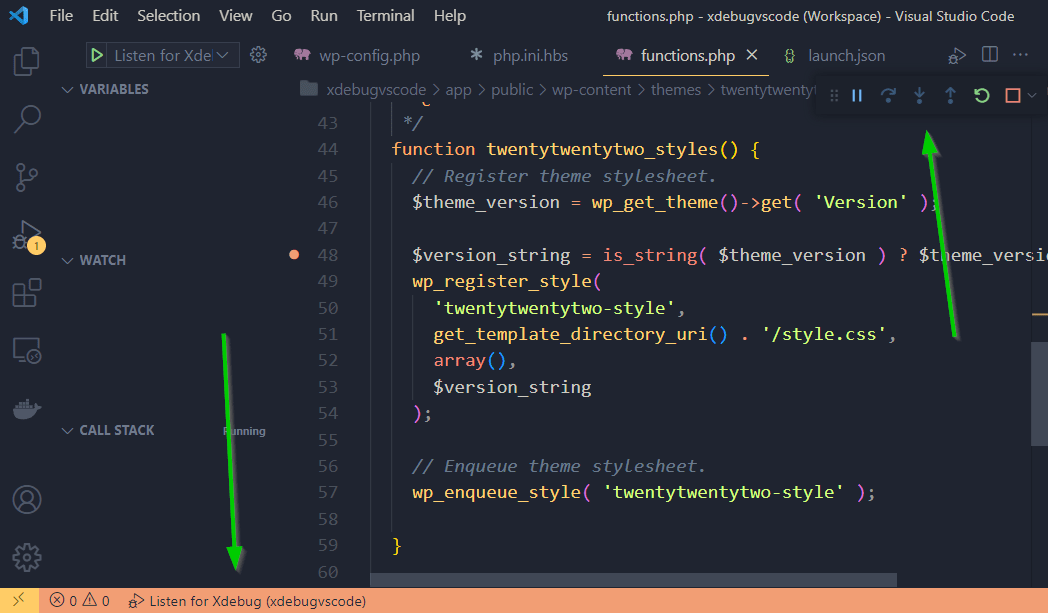
Now Xdebug is waiting to start the session. To kick things off, just load a page that will hit the breakpoint.
I’m just going to load the homepage of the test site I created. Once I hit refresh on the homepage of the test site, VS Code will be highlighted in the taskbar and the debugger will stop executing code on the breakpoint that I had previously set.
Once a debugging session has started, additional controls will be active on the Debugger Control Panel, and variables will be listed under the VARIABLES section of the Debugging Panel.
We can now use the Debugger Controls to navigate through the codebase:
Debugger Controls
- Pause/Run (F6): Resumes code execution. Debugger will stop on the next breakpoint if set.
- Step Over (F10): Steps over a block of code.
- Step Into (F11): Steps into a block of code.
- Step Out (Shift + F11): Steps out of a block of code that was previously stepped into.
- Restart (Ctrl + Shift + F5): Restarts the debugging session.
- Stop (Shift+F5): Halts execution of the script.
The GIF at the top of this article demonstrates some basic usage of these controls.
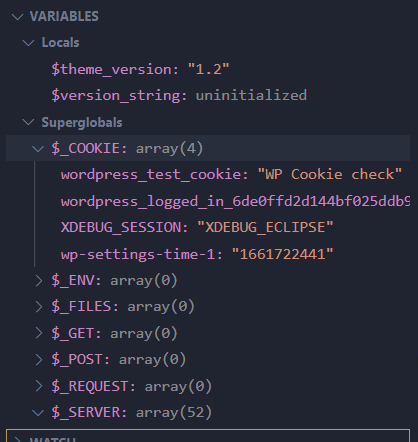
Exploring Variables
We can also explore the values of local and global variables using the VS Code’s VARIABLES section within the Debugging Panel.
PHP Version 8 + Xdebug Version 3 Set Up
When a Local site is configured to use PHP Version 8.X, the bundled version of Xdebug will be Version 3, and there are many changes from Versions 2 to 3.
These changes are covered thoroughly in this guide. Notably, Xdebug Version 3 defaults to port 9003 instead of 9000. I’m going to switch my Xdebug Version 3 setup to use port 9000 for consistency, so I don’t have to change anything in my launch.json file.
Here are the Xdebug directives in my PHP Version 8 site’s php.ini.hbs file. Note that I’ve commented out the line xdebug.start_with_request.
xdebug.mode=debug
xdebug.client_port="9000"
; xdebug.start_with_request=yes
xdebug.discover_client_host=yes
Now that we’ve switched our site to PHP Version 8 if we check the output of our pi.php file that we created earlier, we can see that Xdebug Version 3 is now loaded, where Version 2.9.0 was being used under our PHP Versions 7.3 and 7.4 sites.
One of the cool features that comes bundled with Xdebug Version 3 is the addition of the xdebug_info() function. This is similar to the php_info() function, but it provides more detailed diagnostics for about the Xdebug setup.
To use it, simply add a file to your site’s web root. For example, xdebug-info.php , then add the following contents:
<?php
xdebug_info();
Load that file up in your browser, and you’ll see something like this:
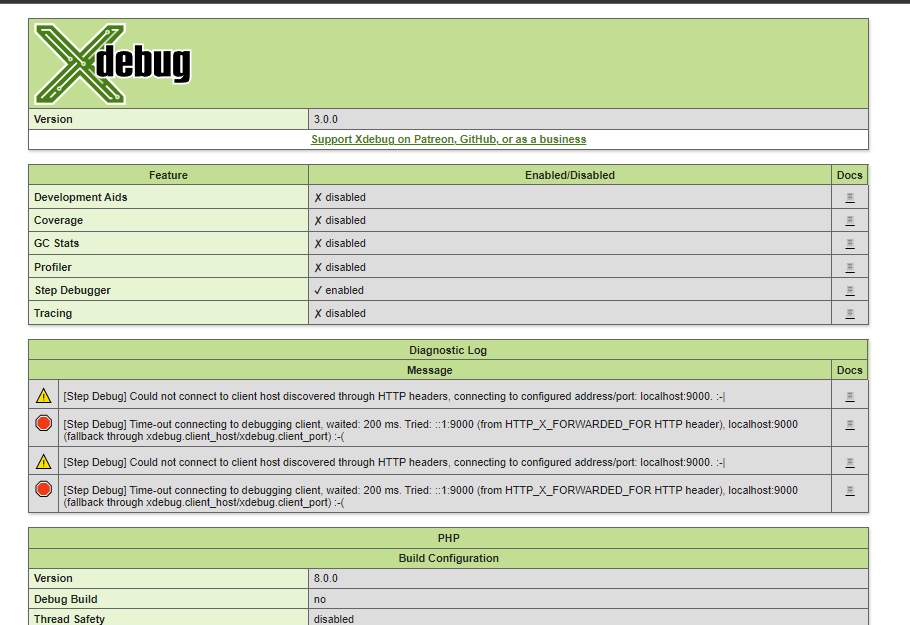
In the screenshot above, the diagnostics log is indicating a problem connecting to the host on port 9000. The reason for this is that I have not enabled VS Code to listen for debugging.
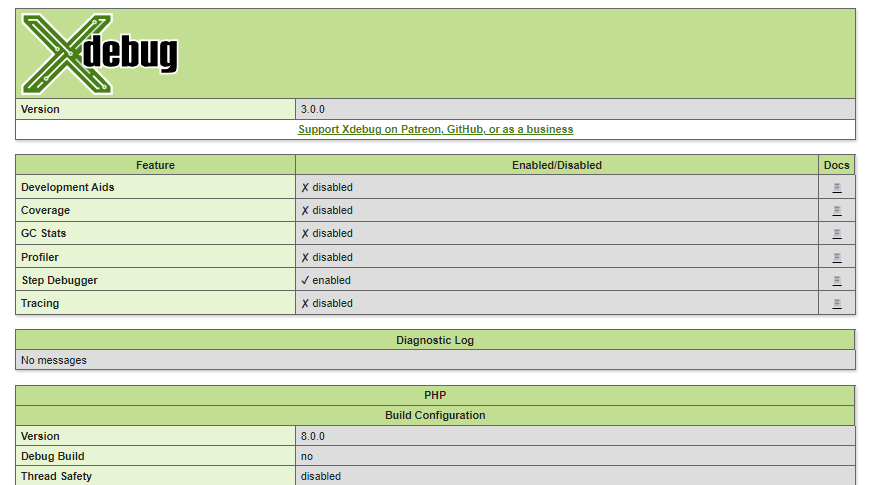
So, I tap F5 to enable debugging, and now when I reload my xdebug-info.php, the Diagnostics Log is clean, and I’m ready to debug. Thanks to fellow WebDevStudios Backend Engineer, Biplav Subedi, for this tip!
Troubleshooting
One common issue that comes up when you’re debugging WordPress is that the debugger does not stop on the breakpoint that you’ve set. This is typically caused by a port conflict—some other process is already using the port that you’ve configured for debugging.
Make sure that no other application is using the port that was configured in the php.ini.hbs and launch.json file. If an application is already using the port you’ve specified, make sure to change your port to something that’s not in use.
To check for a port conflict, end your debugging session in VS Code then run the following command:
Windows CMD: netstat -an | find "9000"
Linux/Mac: sudo netstat -nap | grep ":9000"
You should not see any output after entering these commands. If you do, that means that a process is already using the port you’ve configured for Xdebug (9000) in our example. So you should either configure a different port in your php.ini.hbs and launch.json files, or locate the process that is tying up the port, and stop it/configure it to use a different port.
Bonus: Quick and Dirty Debugging
Sometimes, instead of using Xdebug, I prefer to simply log variables to WP’s error.log file using PHP’s error_log().
I find this handy for real quick stuff, though it’s really not the best way to debug WordPress when things get serious. For this setup, first, add the following statements to your site’s wp-config.php file:
define( 'WP_DEBUG', true ); // Debugging mode activated.
define( 'WP_DEBUG_LOG', true ); // Logs to wp-content/debug.log
define( 'WP_DEBUG_DISPLAY', false ); // Don't add errors to the output.
define( 'SCRIPT_DEBUG', true ); // Load un-minified scripts.
Now, errors will be logged to your site’s wp-content/debug.log file. I typically keep this file open in a side panel of VS Code.
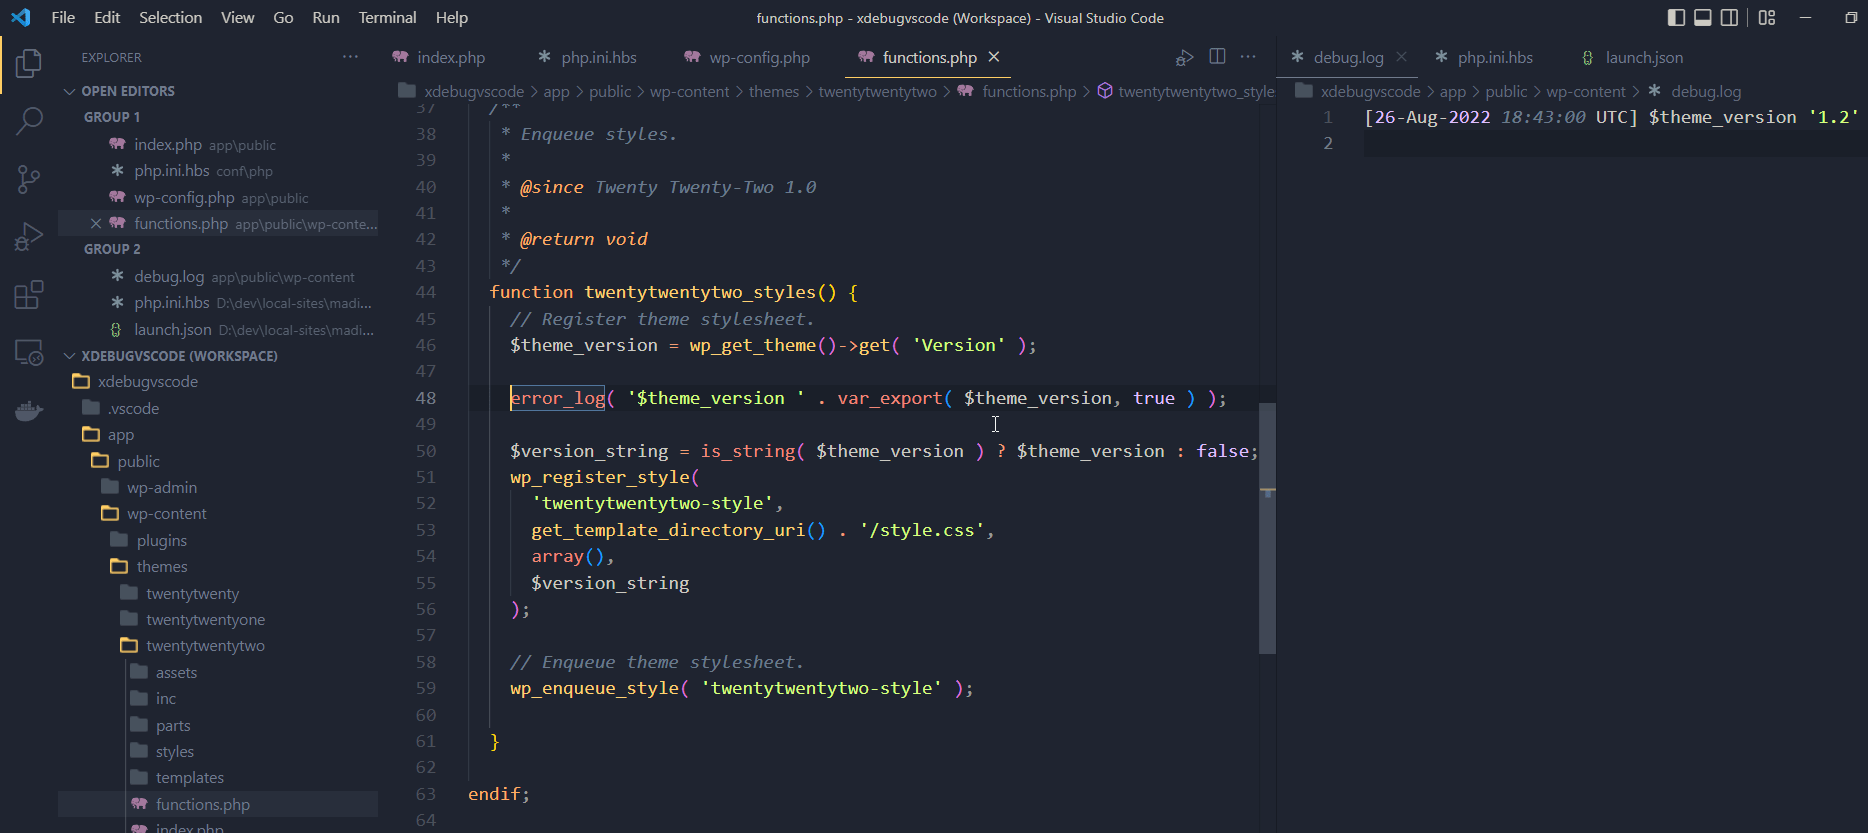
I usually use this one-liner to output values to the debug.log file: error_log( '$variable_name ' . var_export( $variable_name, true ) );
To make things easier, I trigger this one-liner using a VS Code User Snippet with the trigger logv. Here’s a copy of the debugging-related snippets I use. These are configured in VS Code under File > Preferences > Configure User Snippets > PHP.
{
// Place your snippets for php here. Each snippet is defined under a snippet name and has a prefix, body and
// description. The prefix is what is used to trigger the snippet and the body will be expanded and inserted. Possible variables are:
// $1, $2 for tab stops, $0 for the final cursor position, and ${1:label}, ${2:another} for placeholders. Placeholders with the
// same ids are connected.
// Example:
// "Print to console": {
// "prefix": "log",
// "body": [
// "console.log('$1');",
// "$2"
// ],
// "description": "Log output to console"
// }
"Log var_export()": {
"prefix": "logv",
"body": ["error_log( '$1 ' . var_export( $2, true ) );"],
"description": "Do a var_export( $variable ) to PHP error log."
},
"Log print_r()": {
"prefix": "logp",
"body": ["error_log( print_r( $0, true ) );"],
"description": "Do a print_r( $variable ) to PHP error log."
},
"Exit with var_dump()": {
"prefix": "xvd",
"body": ["exit( var_dump( $0 ) );"],
"description": "Exit with var_dump()"
},
"Exit with print_r()": {
"prefix": "xpr",
"body": ["exit( print_r( $0 ) );"],
"description": "Exit with print_r()"
},
"Detailed Error Log": {
"prefix": "logd",
"body": [
"error_log( print_r( (object)",
"t[",
"tt'line' => __LINE__,",
"tt'file' => __FILE__,",
"tt'dump' => [",
"ttt$0,",
"tt],",
"t], true ) );"
],
"description": "Detailed error logging"
},
"Log gettype()": {
"prefix": "logt",
"body": ["error_log( gettype( $0 ) );"],
"description": "Do a gettype( $variable ) to PHP error log."
},
"Debug Filters": {
"prefix": "logf",
"body": ["add_action( 'all', function() { error_log( var_export( current_filter(), true ) ); } );"],
"description": "Logs current filter."
}
}
Conclusion
That’s about it for this post on debugging WordPress using Xdebug, Local, and VS Code. Using Xdebug, you’ll be able to more efficiently and effectively debug code. If you’ve never used it before, I’m sure you will find that Xdebug is a helpful tool in your development arsenal.
it is easy to understand… great
awesome post! idk why it took me so long to find this, but it was extremely helpful. I think with newer versions of Local WP (I’m running 6.6.1+6281), there is a Xdebug toggle at the bottom of the app “Tools” screen.
It is defaulted to “off” so make sure you toggle it to “on.”
In the `php.ini.hbs` file, there is a conditional that checks if `xdebugEnabled`:
{{#if xdebugEnabled}}
xdebug.mode=debug,develop
{{else}}
xdebug.mode=off
{{/if}}
It also seems the newer versions includes its own “xdebug info” page. From that “Tools” screen, you can click “Details” link next to the the xdebug toggle and it will bring you to this page:
http://localhost:/local-xdebuginfo.php
hope that helps!
whoops, my last comment should have said “Overview” tab, not “Tools”
wow…ok last comment, i hope…after a little more back tracking and “setting up” xdebug based on this article, newer versions of Local WP (6.6.1+6281), you seem to only need to toggle the “Xdebug” setting “on” from the “Overview” page and don’t actually need to copy any of the configs from this article. It seems that just the plugin is needed to be installed. Still helpful none the less!
briljant article !
Thanks for putting this together,
Since PHP 8.x is much more strict, hosters stopping support for PHP 7.x and WordPress website themes and plugins will need to be fixed, this article comes in time.